Figure 4.
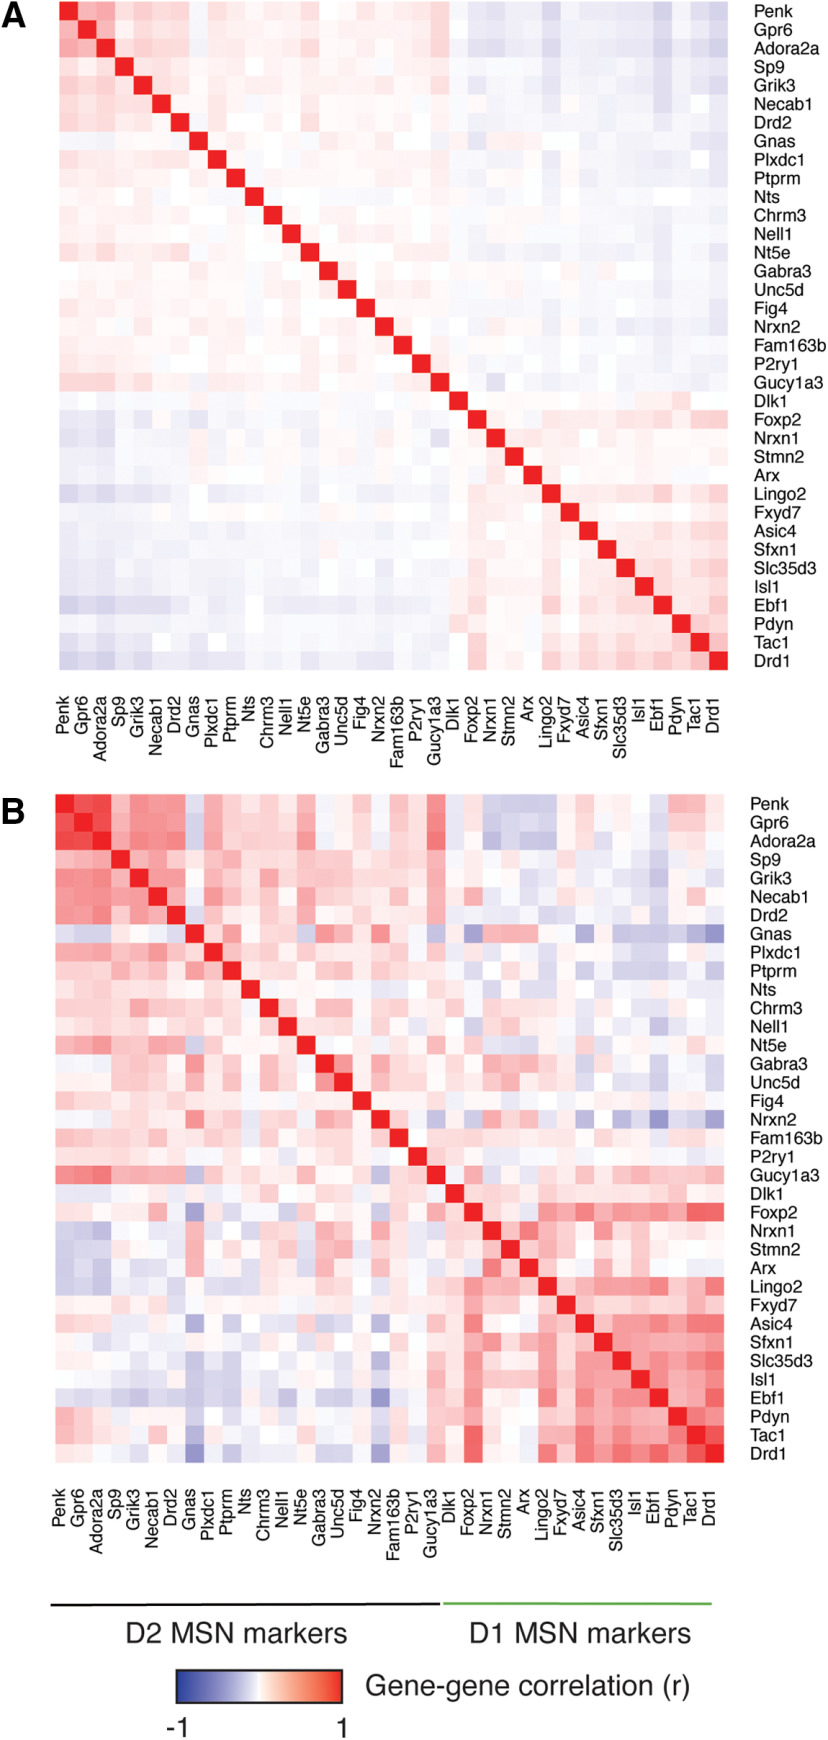
Smoothing rescues gene-gene correlation structure among markers of D1 versus D2 MSNs. A, Pearson correlations among 36 marker genes for D1 versus D2 MSNs in normalized, non-smoothed counts from the 4524 cells in our dataset. B, Pearson correlations among the same 36 marker genes using smoothed counts. The 36 marker genes are the same genes shown in Figure 1C and are ranked in order of subtype specificity based on data from the DropViz atlas.

