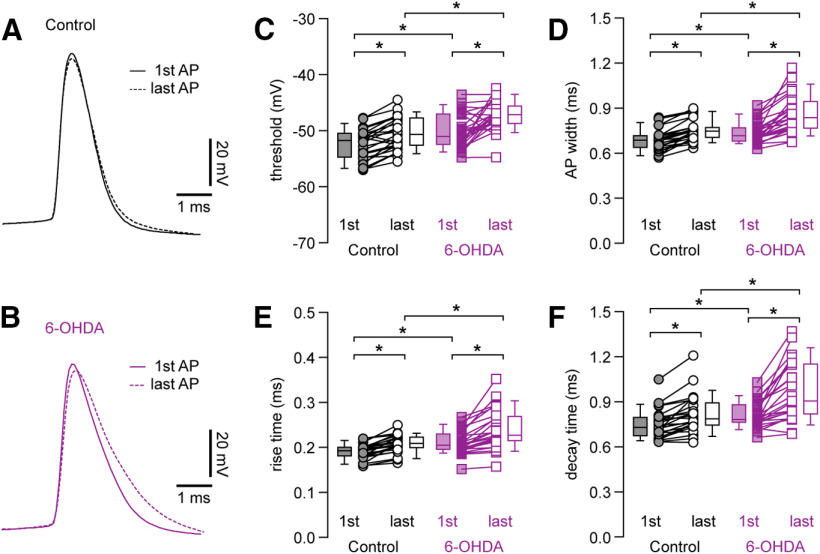
Figure 5.
Progressive changes in AP waveforms of M1 PTNs during repetitive firing. A, B, The first and the tenth APs from a 10-Hz spike train were superimposed for PTNs from control (A) or 6-OHDA mice (B). APs were aligned at threshold, and the solid and dashed lines indicated the first and the last APs from the spike train, respectively. C, Summarized graphs showing the alterations of AP threshold between the first and the last APs. Each line connects the AP width of the first and the last APs from the same spike train. Box plots indicate the median plus interquartile range of the first and the last AP. D–F, Summarized graphs showing changes in AP width (D), rise time (E), and decay time (F) between the first and the last APs in PTNs from 6-OHDA mice relative to those from controls; *p < 0.05, WSR or MWU tests.

