Figure 6.

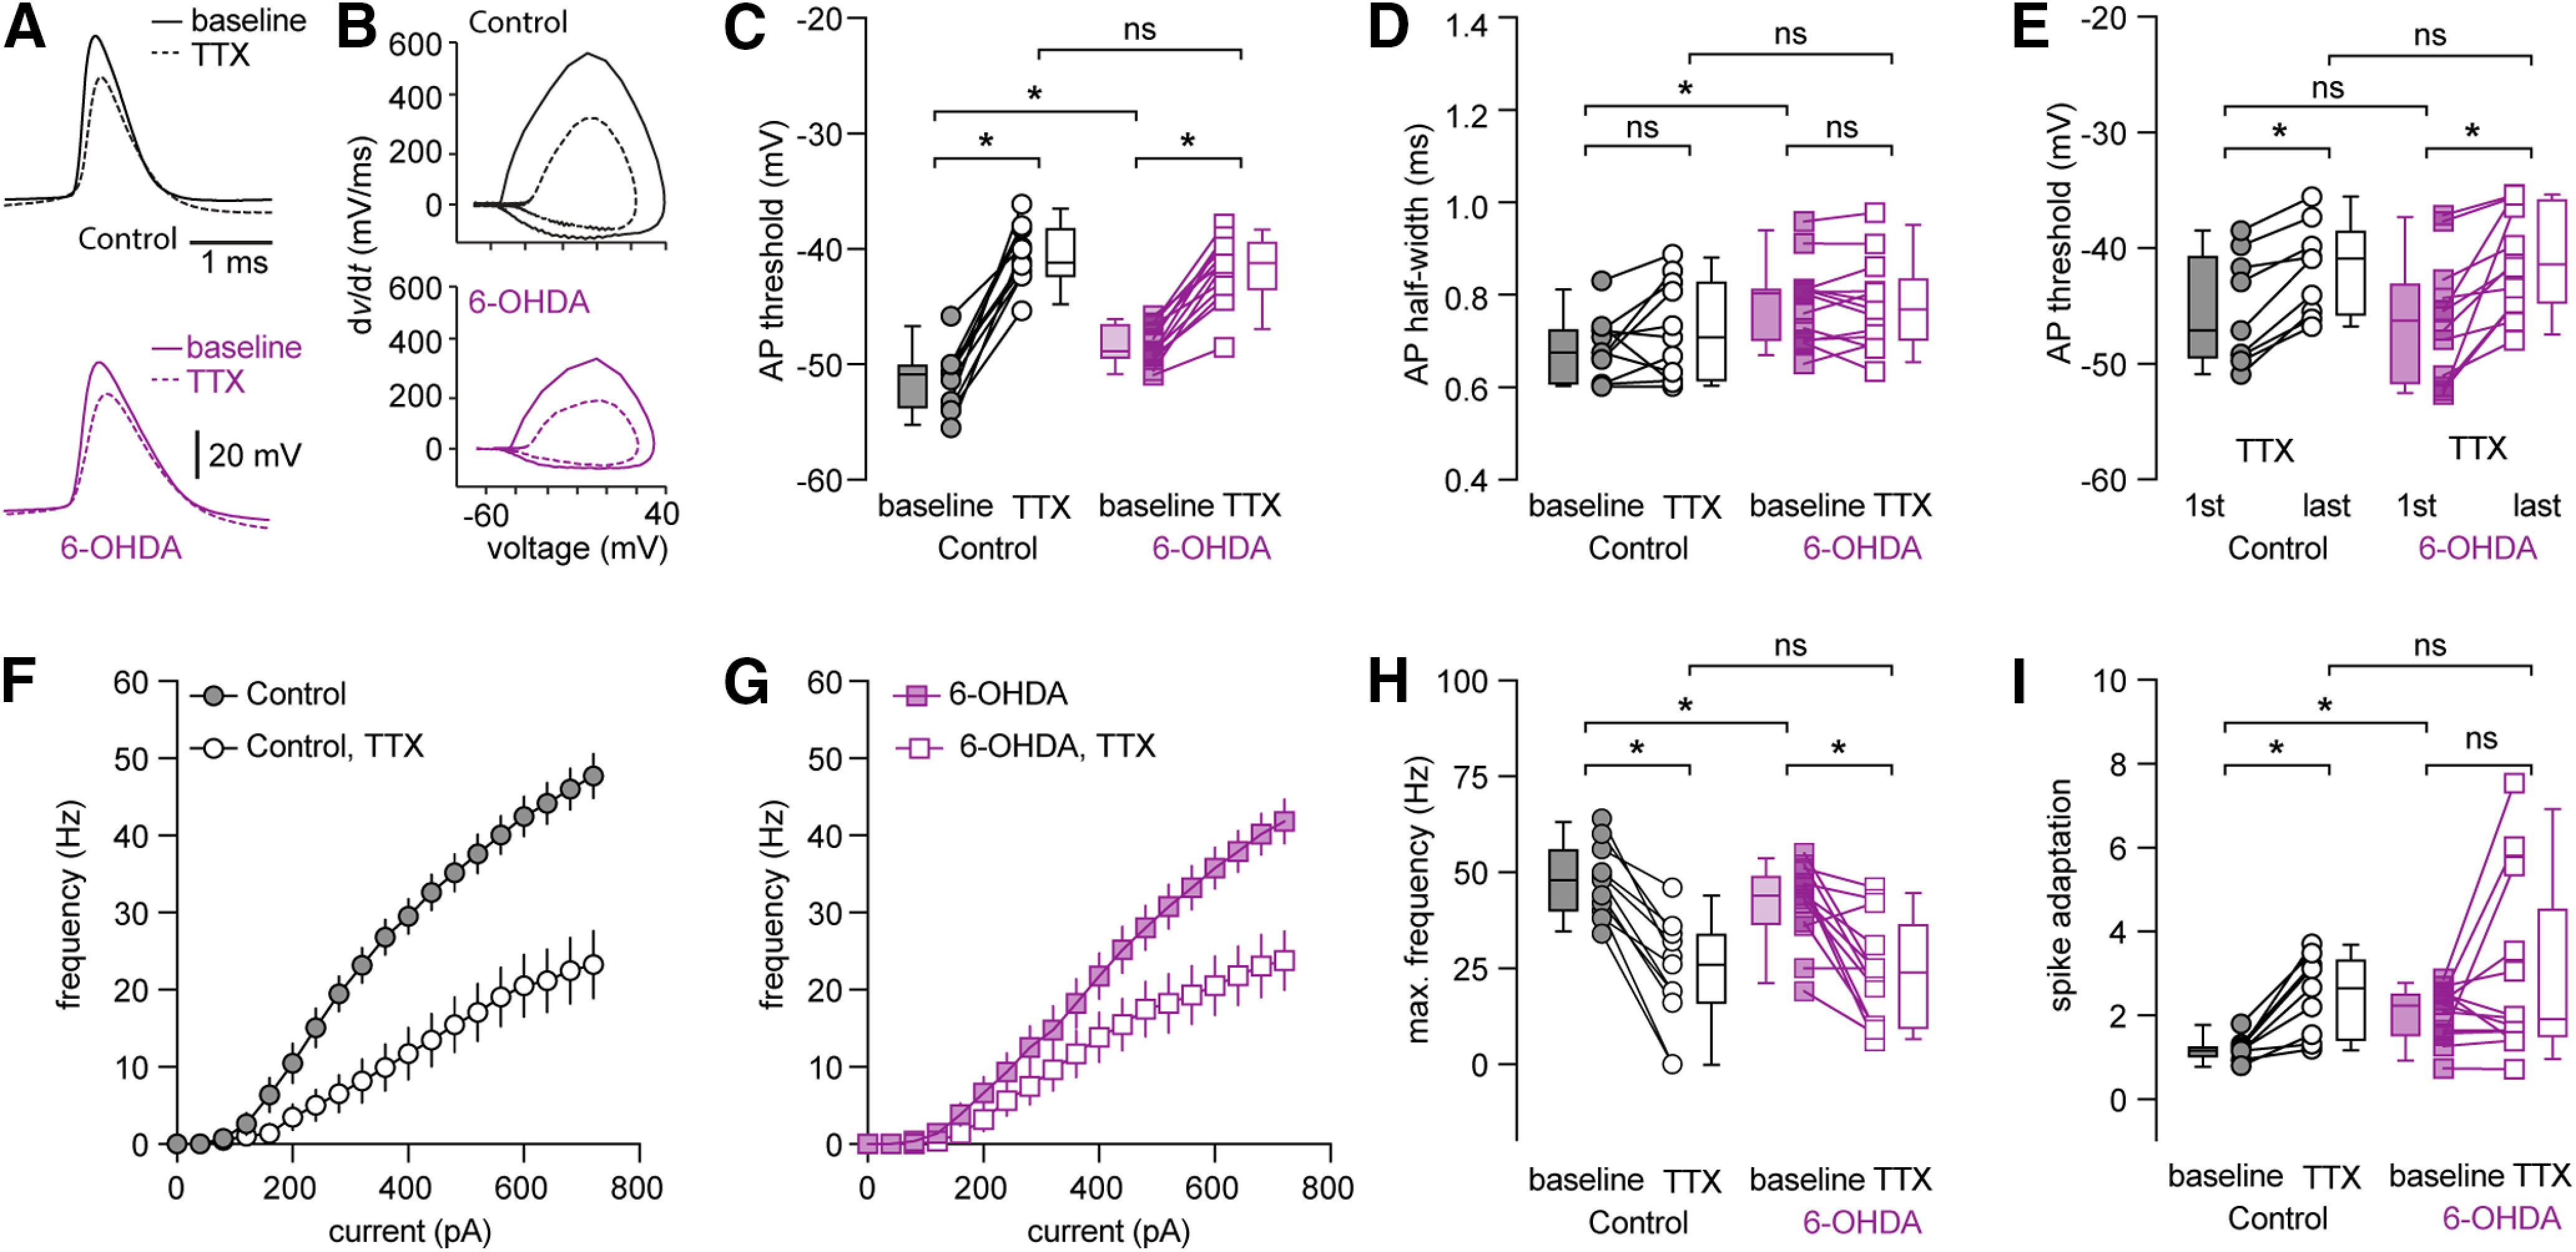
Low-concentration TTX excludes the decreased intrinsic excitability of PTNs in 6-OHDA mice versus controls. A, B, Representative AP waveforms of PTNs at rheobase from controls (A, up) and 6-OHDA mice (A, bottom) and the corresponding phase plane plots at baseline and in the presence of TTX (20 nm). C, D, Summarized graphs showing changes in AP threshold (C) and half-width (D) at rheobase in the absence and presence of TTX (20 nm). E, Summarized graph showing threshold changes of PTNs from controls and 6-OHDA mice during repetitive firing of 10 APs in the presence of TTX (20 nm). F, G, Current-frequency curves of PTNs from controls and 6-OHDA mice in the absence and presence of TTX (20 nm). H, I, summarized graphs showing changes in the maximal firing frequency (H) and spike adaptation (I) of PTNs from controls and 6-OHDA mice in the absence and presence of TTX (20 nm); *p < 0.05, n.s., not significant. WSR or MWU tests.
