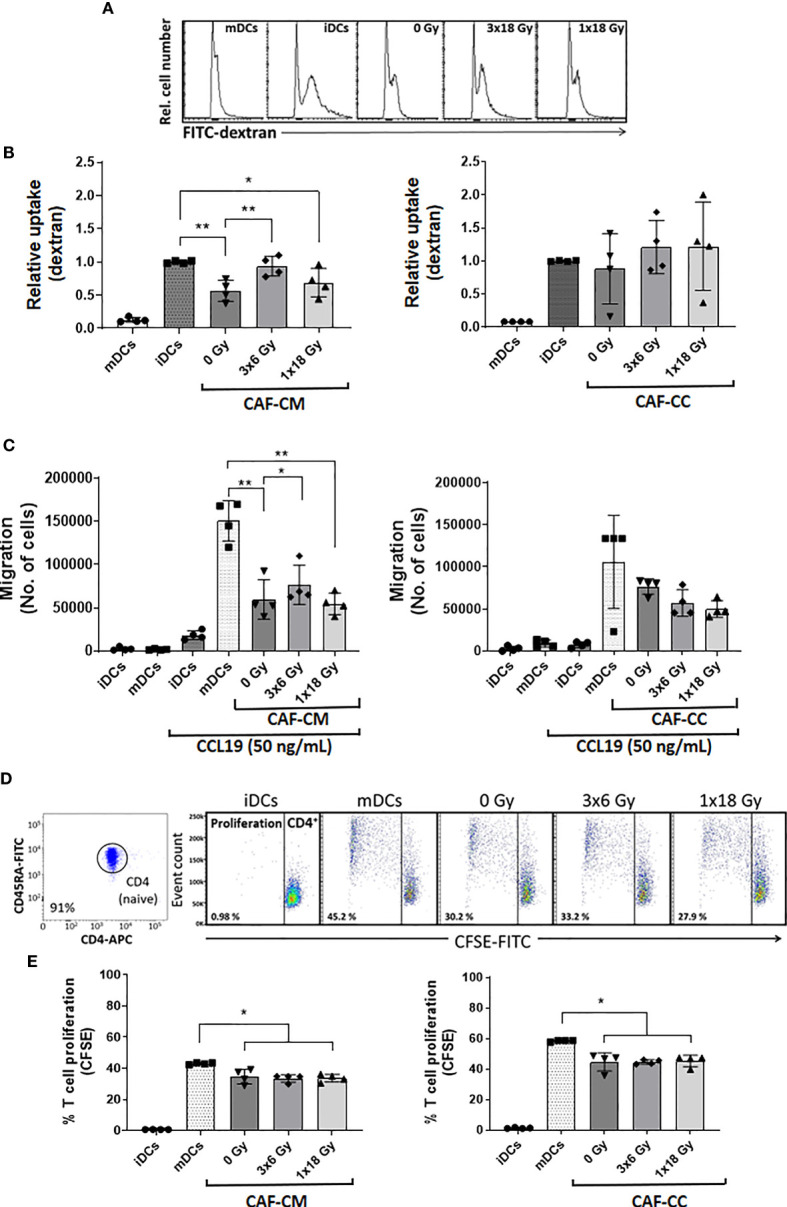
Figure 5.

CAF-mediated effects on DC functions. Antigen uptake capacity by DCs was analyzed by flow cytometry. After initial treatments, DCs were cultured for 60 min in the presence of FITC-dextran. Relative FITC-dextran uptake was calculated by subtracting MFI of cells incubated for 60 min on ice from MFI of cells allowed to internalize antigen during 60 min at 37°C. (A) Representative histograms indicating MFI of FITC-dextran uptake by mDCs. (B) Bar graphs represent mean ( ± SD) values from flow cytometry analysis of four-4 different CAF donors measured independently. (C) DC migration rates were measured by the Boyden chamber assay. The total number of cells that migrated towards a CCL19 gradient during 3h was determined for each experimental group. (D, E) DCs T cell priming capacity was analyzed by CFSE-dilution assay. Naive CD4+ T cells were co-cultured with mDCs (ratio 2:1) in the presence of CAFs or CAF-CM for 7 days and the percentage of proliferating T cells was determined by flow cytometry. (D) Representative dot plots indicating the percentage of purity of CD4RA naive T cells and the percentage of the proliferation of CD4 cells co-cultured with mDCs. (E) The bar graphs represent mean ( ± SD) values from flow cytometry analysis of 4 different CAF donors measured independently. Dead cells were excluded from the analysis by PI fluorescence. Brown-Forsythe and Welch ANOVA test and p-values were determined between controls and non-irradiated CAFs, mDCs, and the two irradiated CAF-groups individually. *p ≤ 0.05, **p ≤ 0.01.
