Figure 7.
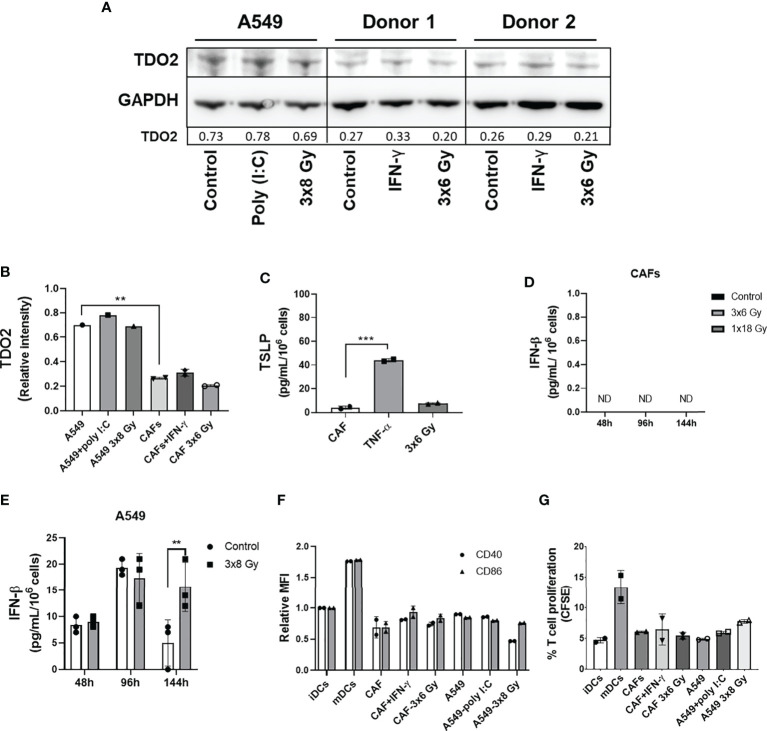
Effect of radiation on expression of CAF immunomodulators and DC immunoregulation by irradiated CAFs supernatants. Cultures were irradiated with fractionated doses of 6 Gy (CAFs) and 8 Gy (A549) during three consecutive days. (A) Protein expression of TDO2 was determined by Western blotting and results were normalized against GAPDH expression. For positive controls, A549 cells were stimulated with 0.1 µg/mL of poly (I:C) and CAFs were stimulated with 10 ng/mL of IFN-γ. In (B), relative intensity of the bands corresponding to panel A, determined by densitometry, is shown as a bar graph. Data represent mean (± SD) values from two different CAF donors. In (C), the resulting levels of TSLP were quantified by ELISA. For positive controls, CAFs were stimulated with 10 ng/mL of TNF-α. Data represent mean ( ± SD) values from two different CAF donors measured in duplicates. The effect of radiation on the secretion of IFN-β by CAFs (D) and by A549 cells (E) was analyzed by ELISA assay. IFN-γ secretion in supernatants was determined 48, 96, and 144h post-irradiation. In (F), the resulting expression of co-stimulatory markers CD40 and CD86 on DCs treated with CM from non-irradiated and irradiated CAFs (3x6 Gy) and A549 tumor cells (3x8 Gy) were evaluated by flow cytometry. In (G), naive CD4+ T cells were co-cultured for 7 days with DCs (ratio 2:1) stimulated with CM from non-irradiated and irradiated CAFs (3x6 Gy) and A549 tumor cells (3x8 Gy), and percentage of proliferating T cells was determined by flow cytometry. Dead cells were excluded from the analysis by based on PI fluorescence. Data represent the mean ( ± SD) values from triplicates. Two-way ANOVA test and p-values were determined between non-irradiated vs irradiated cells. Brown-Forsythe and Welch ANOVA test and p-values were determined between control and TNF-α stimulated CAF-CM and control vs irradiated CAFs. ***p ≤ 0.001, ***p ≤ 0.001. ND, not detected.

