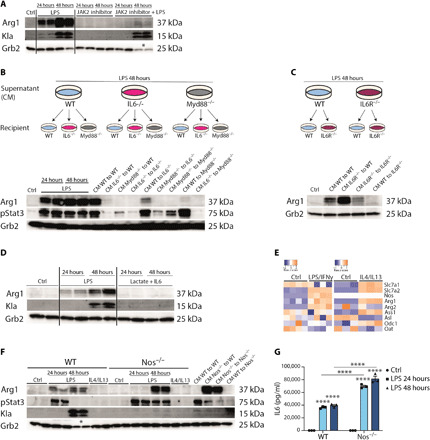
Fig. 2. Arg1 expression is controlled by IL6.

(A) Wild-type (WT) BMDMs were stimulated with LPS and treated with the JAK2 inhibitor AG 490 or both. Data shown are representative of three experiments. (B) Wild-type, Il6−/−, and Myd88−/− BMDMs were stimulated with LPS for 24 or 48 hours. CM of LPS, 48-hour–stimulated BMDMs of all genotypes, were transferred to naïve wild-type and Il6−/− and Myd88−/− BMDMs for further 24 hours. (C) Wild-type and Il6r−/− BMDMs were stimulated with LPS for 48 hours. CM were transferred to naïve wild-type and Il6r−/− BMDMs. (D) Whole-cell lysates of wild-type BMDMs, which were left untreated (Ctrl) or treated with LPS or lactate + IL6, were analyzed by Western blotting. (E) Heatmaps showing transcriptomic data from profile GSE115354 and RNA-seq analysis of Ctrl and IL4/IL13-stimulated BMDMs. (F) Wild-type and Nos2−/− BMDMs were left untreated or stimulated with LPS or IL4/IL13. CM of both genotypes were transferred to untreated wild-type and Nos2−/− BMDMs. (G) Concentration of IL6 in the supernatant of wild-type and Nos2−/− BMDMs stimulated with LPS was measured by enzyme-linked immunosorbent assay (ELISA). n = 3 biological replicates. Statistically significant differences were determined by a two-way ANOVA with Tukey correction; * displays that increased cell death was observed and therefore loading control (Grb2) was decreased. All values are means ± SEM; ****P < 0.0001. If not indicated otherwise, superscripts show statistical significance compared to the control group.
