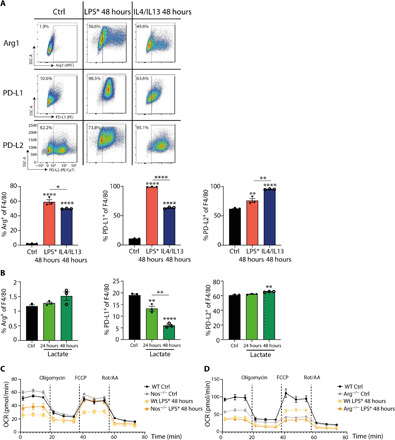
Fig. 4. Arg1 controls the bioenergetic state of inflammation-induced regulatory macrophages.

(A) Representative blots of wild-type BMDMs stimulated with LPS or IL4/IL13 for the indicated time and percentages of Arg1+, PD-L1+ and PD-L2+ or F4/80+ macrophages were determined by flow cytometry analysis. Data shown are representative of three independent experiments. SSC-A, side scatter area; APC, allophycocyanin; PE, phycoerythrin. (B) Wild-type BMDMs were stimulated with solvent (Ctrl) or lactate for the indicated time, and the percentages of Arg1+, PD-L1+, and PD-L2+ or F4/80+ macrophages were determined by flow cytometry analysis. Data represent two independent experiments. (C) Wild-type and Nos2−/− BMDMs were left untreated or were treated with LPS*. The cells were sequentially treated with oligomycin, carbonyl cyanide-4 (trifluoromethoxy) phenylhydrazone (FCCP), and rotenone/antimycin A (Rot/AA), and the oxygen consumption rate (OCR) was determined. (D) Wild-type or Arg1-deficient BMDMs were left untreated or were treated with LPS*, and mitochondrial respiration was measured. All values are means ± SEM; *P < 0.05; **P < 0.01; and ****P < 0.0001. Statistically significant differences were determined by one-way ANOVA with Tukey correction. If not indicated otherwise, superscripts show statistical significance compared to the control group. n = 3 biological replicates.
