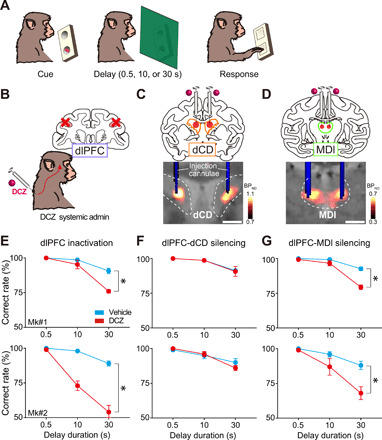
Fig. 2. Chemogenetic silencing of the bilateral dlPFC-MDl pathway selectively impaired the performance of a delayed response task.

(A) Delayed response task. (B) Schematic diagram representing inactivation of dlPFC by systemic DCZ administration. (C) Chemogenetic silencing of the dlPFC-dCD pathway by local DCZ infusion (100 nM, 3 μl per site) into bilateral dCD, specifically at hM4Di-positive dlPFC terminals sites. A CT image showing the infusion cannulae (blue) overlaying a structural MR image (gray), and a PET image showing a high [11C]DCZ binding region (hM4Di expression, hot color). (D) Chemogenetic silencing of the dlPFC-MDl pathway by local DCZ infusion (2 μl per site) into bilateral MDl. (E) Behavioral effects of chemogenetic dlPFC inactivation. Correct performance rate (means ± SEM, n = 5 sessions for each treatment in each monkey) following DCZ (red) and vehicle infusions (cyan) are shown for two monkeys [two-way ANOVA with treatment × delay; treatment: Mk#1, F(1,24) = 20.8, P < 0.001; Mk#2, F(1,24) = 90.8, P < 0.001; delay: Mk#1, F(2,24) = 60.9, P < 0.001; Mk#2, F(2,24) = 57.4, P < 0.001; interaction: Mk#1, F(2,24) = 11.4, P < 0.001; Mk#2, F(2,24) = 22.3, P < 0.001]. (F) Same as (E) but for the PFC-CD pathway [treatment: Mk#1, F(1,24) = 0.03, P = 0.86; Mk#2, F(1,24) = 0.20, P = 0.66; delay: Mk#1, F(2,24) = 19.3, P < 0.001; Mk#2, F(2,24) = 20.0, P < 0.001; interaction: Mk#1, F(2,24) = 0.03, P = 0.97; Mk#2, F(2,24) = 1.2, P = 0.31]. (G) Same as (E) but for the PFC-MD pathway [treatment: Mk#1, F(1,24) = 32.9, P < 0.001; MK#2, F(1,24) = 12.6, P = 0.002; delay: Mk#1, F(2,24) = 79.0, P < 0.001; Mk#2, F(2,24) = 19.8, P < 0.001; interaction: Mk#1, F(2,24) = 16.5, P < 0.001; Mk#2, F(2,24) = 3.8, P = 0.04]. Dashed lines represent the borders of the caudate nucleus and mediodorsal thalamus, respectively. Asterisks indicate P < 0.05 for significant main effect of treatment. Scale bars, 5 mm.
