
Fig. 4. PA4 increases muscle fiber area and improves strength in aged mice with muscular dystrophy.
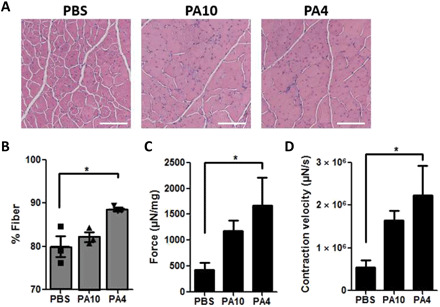
(A) Representative H&E of TA muscles, approximately 3 weeks after termination of daily microdamage and 2 weeks after treatment. Magnification, ×10. Scale bar, 300 μm. (B) Percentage of the TA cross section associated with muscle fibers. ANOVA with Tukey’s post hoc test; data are means ± SEM, n = 3. *P < 0.05. (C and D) Maximum TA muscle contraction force and velocity after ex vivo stimulation at 250 Hz, 25 V. Force was normalized to TA mass. ANOVA with Tukey’s post hoc test; data are means ± SEM; n = 5 to 6. *P < 0.05.