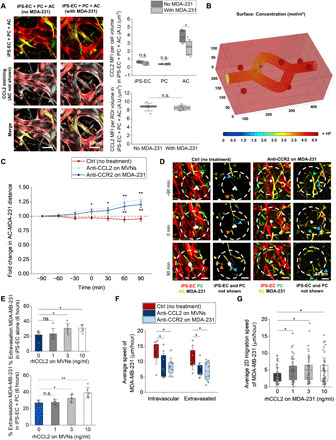
Fig. 4. Increased extravasation at the brain results from chemotactically and chemokinetically driven CCL2-CCR2 interactions between ACs and TCs.

(A) Representative CCL2 staining in triculture MVNs with and without MDA-231 cells and quantification of the CCL2 MFI per cell volume with and without TCs. CCL2 is shown in white, iPS-EC in red, PC in green, and AC in yellow. A.U., arbitrary units. (B) Heatmap of the CCL2 concentration in the 3D MVNs surrounded by ACs with an intravascular TC. Only diffusion is considered here given the absence of luminal fluid flow in the MVNs. (C) AC-TC distance near extravasating TCs over time in triculture MVNs with anti-CCL2 on MVNs or anti-CCR2 on TCs. (D) Representative images of extravasating TCs and its surrounding ACs over time in triculture MVNs with and without anti-CCR2 on TCs. The blue, green, and orange arrows at the different time points refer to individual ACs moving closer to the TC in the control case, or away from it in the anti-CCR2 case. (E) Extravasation efficiency of MDA-231 in monoculture iPS-EC and coculture iPS-EC + PC MVNs at 6 hours after perfusion, in the case of MVNs treated with different recombinant human CCL2 (rhCCL2) concentrations. (F) Average speed of MDA-231 before and after extravasation in the triculture MVNs treated with anti-CCL2 or for the case of TC treatment with anti-CCR2. (G) Average 2D migration speed of MDA-231 with or without rhCCL2 treatment at different concentrations. *P < 0.05, **P < 0.01, ***P < 0.001, and ****P < 0.0001; not significant; n.s.#, not significant across all conditions (pairwise).
