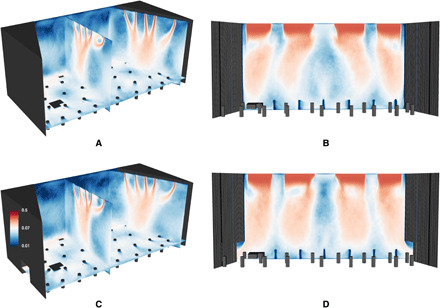
Fig. 2. Time-averaged velocity field in Abravanel Hall.

(A) Slices at center stage and stage left with doors closed. (B) Front view of the velocity at mid-stage with doors closed. (C). Slices at center stage and stage left with doors open. (D) Front view of the velocity at mid-stage with doors open. The colormap ranges from 0.01 to 0.5 m/s on a log scale.
