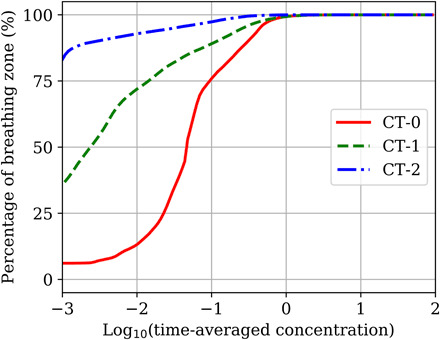
Fig. 8. Cumulative function for percentage of the breathing zone volume in Capitol Theater occupied by a certain concentration range.

The x axis is plotted on a log scale. The y axis values represent the percentage of the breathing zone with a concentration less than or equal to the corresponding x axis value.
