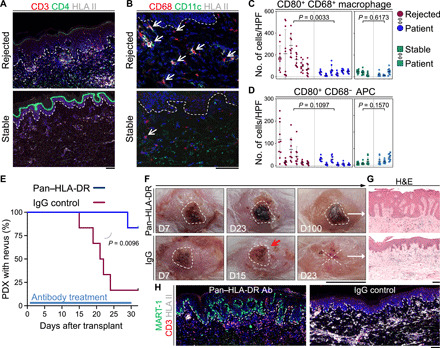
Fig. 5. HLA II blockade inhibits the CD4+ T cell–mediated rejection of nevus PDX.

(A) Representative IF images of CD3-stained (red), CD4-stained (green), and HLA II–stained (light gray) sections of the rejected and stable nevus PDXs. Dashed lines highlight the epidermal basement membrane. Scale bar, 100 μm. (B) Representative IF images of CD68-stained (red), CD11c-stained (green), and HLA II–stained (light gray) sections of the rejected and stable nevus PDXs. Dashed lines highlight epidermal basement membrane, and arrows point to CD68+ macrophages. Scale bar, 100 μm. (C and D) Quantification of CD80+ CD68+ macrophages (C) and CD80+ CD68− APCs (D) in 10 random HPFs per sample of rejected nevus PDXs (n = 6), their participant-matched nevus II (n = 6), stable nevus PDXs (n = 3), and their participant-matched nevus II (n = 3) samples (nested t test). (E) Time to nevus PDX rejection comparing pan–HLA-DR antibody–treated (blue, n = 6) to IgG control–treated (red, n = 6) PDX mice (log-rank test). (F) Representative images of pan–HLA-DR antibody–treated nevus PDX at days 7, 23, and 100 after transplant and IgG control–treated nevus PDX at days 7, 15, and 23 after transplant. Dashed lines outline the area of the nevus on the human skin, X signifies nevus rejection, and red arrow points to the inflammation at the site of the nevus PDX. Scale bar, 1 cm. (G) Representative images of H&E-stained sections from pan–HLA-DR antibody– and IgG control–treated nevus PDXs. Scale bar, 100 μm. (H) Representative IF images of MART-1–stained (green), CD3-stained (red), and HLA II–stained (light gray) sections of pan–HLA-DR antibody (Ab)– and IgG control–treated nevus PDXs. Dashed lines indicate epidermal basement membrane. Scale bar, 100 μm. Photo credit: Erik B. Schiferle, Massachusetts General Hospital.
