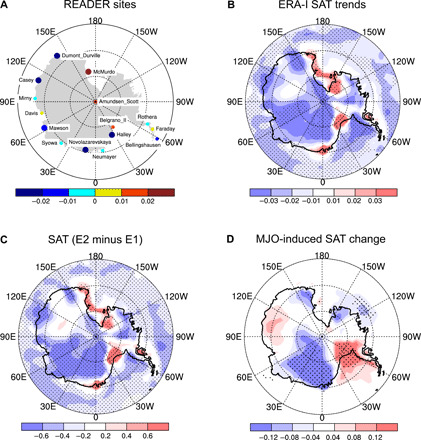
Fig. 1. Changes in the Antarctic SAT in austral summer (DJF) from 1979 to 2014.

Antarctic SAT trends (K year−1) based on (A) station observations and (B) ERA-I. (C) Differences in SAT (K) between the two epochs of 1997–2014 (E2) and 1979–1996 (E1). (D) SAT changes (E2 minus E1) induced by MJO-related variability estimated by the diagnostic equation, which incorporates the effects of decadal changes in MJO occurrence frequency with the intraseasonal SAT anomaly associated with the MJO (Eq. 1 in Materials and Methods). A large circle in (A) and stippling in (B) to (D) mark the regions with statistically significant changes at the 95% confidence level using the Mann-Kendall test [for the trend test in (A) and (B)], the Wilcoxon-Mann-Whitney test [for (C)], and the Monte Carlo method [for (D)], in which E1 and E2 years were randomly assigned and repeated 1000 times.
