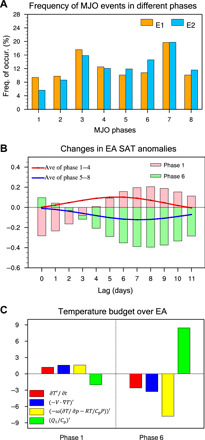
Fig. 2. Decadal changes in MJO activity and their association with East Antarctic SAT change in austral summer for 1979–2014.

(A) Frequency (%) of active MJO days for each MJO phase in the austral summer (DJF) of 1979–1996 (E1; orange bars) and 1997–2014 (E2; blue bars). (B) Evolution of 10- to 90-day bandpass-filtered SAT anomalies (K) over East Antarctica (EA; 30°W to 150°E, 66.5° to 90°S) as a function of lag days after the occurrence of MJO phase 1 (pink bars) and phase 6 (green bars). The superposed is the average of MJO phases 1 to 4 (red curve) and that of phases 5 to 8 (blue curve), respectively. (C) Ten- to 90-day SAT budget terms in EA integrated over days 3 to 11 after the occurrence of MJO phase 1 (left) and phase 6 (right). Red, blue, yellow, and green bars represent the temperature tendency (10−7 K s−1), the effects of horizontal advection, vertical adiabatic heating, and diabatic heating, respectively. An active MJO day is defined when the amplitude of the RMM index is greater than 1.5.
