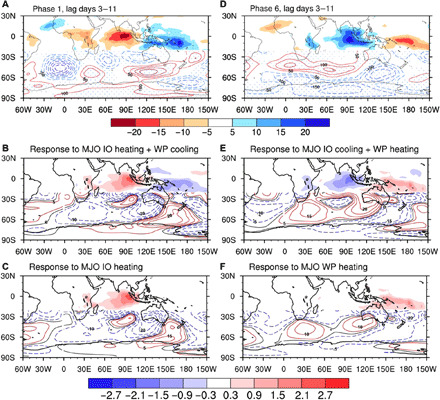
Fig. 3. Responses of large-scale circulation to tropical heating anomalies associated with MJO.

Observed 10- to 90-day bandpass-filtered perturbations of NOAA OLR (shading; W m−2) and 500-hPa geopotential height (contour; m) averaged over days 3 to 11 after the occurrence of MJO (A) phase 1 and (D) phase 6. (B, C, E, and F) Simulated 500-hPa geopotential height (contour; m) in an AGCM forced by mid-tropospheric heating anomalies (shading; K day−1): (B) MJO phase 1–like heating over the Indian Ocean and cooling over the western Pacific, (C) MJO phase 1–like heating over the Indian Ocean only, (E) MJO phase 6–like cooling over the Indian Ocean and heating over the western Pacific, and (F) MJO phase 6–like heating over the western Pacific only. The heating and cooling fields represent the intraseasonal diabatic heating term in the temperature budget equation averaged over MJO phases 1 to 4 for (B) and (C) and phases 5 to 8 for (E) and (F). Stippling in (A) and (D) indicates the regions with statistically significant changes in circulation at the 5% significance level relative to the climatological state.
