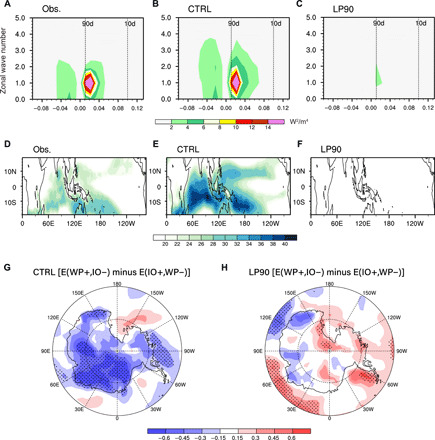
Fig. 4. Sensitivity experiments of coupled GCM for verifying MJO effects on East Antarctic SAT changes.

(A to C) Frequency–wave number analysis of austral summer OLR (W2 m−4) over the tropical Indian Ocean and western Pacific (50°E to 160°W, 10°S to 10°N) derived from (A) observed NOAA OLR data in 1979–2014 and 70-year simulations of (B) free-running control experiment (CTRL) and (C) sensitivity experiment (LP90), in which MJO-related variability is suppressed by nudging the prognostic variables toward 90-day lowpass-filtered components in the CTRL. (D to F) SDs of 10- to 90-day filtered OLR (W m−2) from (D) NOAA OLR observation, (E) control experiment (CTRL), and (F) sensitivity experiment (LP90). (G and H) Differences in austral summer Antarctic SAT (K) between the decades with frequency of MJO days increased in western Pacific but decreased in Indian Ocean [E(WP+,IO−)] and the decades with the opposite MJO activity condition [E(IO+,WP−)] in (G) control experiment (CTRL) and (H) sensitivity experiment (LP90). Stippling marks the region with statistically significant SAT changes at the 99% confidence level.
