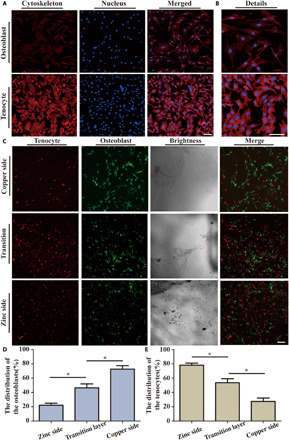
Fig. 4. In vitro assay of cell behavior.

(A) Fluorescence images of cells double-stained with phalloidin for actin filaments (red) and DAPI for nuclei (blue) osteoblasts and tenocytes after culturing in bimetallic ion–based hydrogels for 3 days. (B) The details of the cytoskeleton. (C) The cell distribution on the different hydrogel surfaces. Scale bar, 100 μm. (D and E) Quantification of osteoblast and tenocyte distribution on the bimetallic hydrogels (n = 3) (*P < 0.05).
