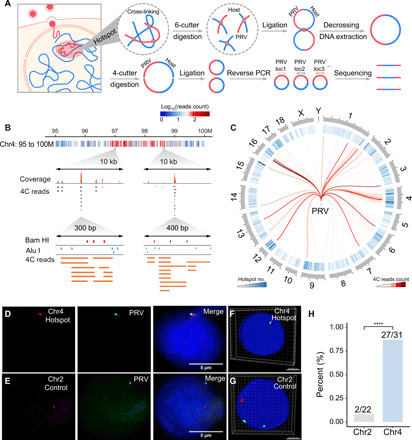
Fig. 1. Detection of chromatin interaction between PRV and host cell.

(A) Schematic illustration of multiple 4C procedure, including attachment, penetration, and chromatin interaction between PRV and the host cell. The chromatin complexes were cross-linked and then digested by Bam HI. After proximity ligation and DNA purification, the DNA fragments were digested by Alu I and then self-ligated for reverse PCR, of which the products were subjected to high-throughput sequencing. (B) Distribution of PRV-host 4C reads in the 95 to 100M region on chromosome 4. Red dots represent Bam HI sites, and blue dots represent Alu I sites. (C) Circos plot of high frequent PRV-host interaction hotspots distributed on each chromosome. (D) DNA hybridization chain reaction (HCR) validation of the colocalization between PRV and hotspot region in Chr4. (E) No colocalization was observed between PRV and noninteracting regions in Chr2. (F and G) Three-dimensional (3D) reconstruction of DNA HCR images of the interaction site (Chr4, hotspot) and noninteraction site (Chr2, control). Green, PRV signals; red, host genome site signal. (H) Quantification of the colocalization ratio of the interaction sites (Chr4, hotspot) and the noninteraction sites (Chr2, control). ****P < 0.0001 from Fisher’s exact test.
