Figure 10.

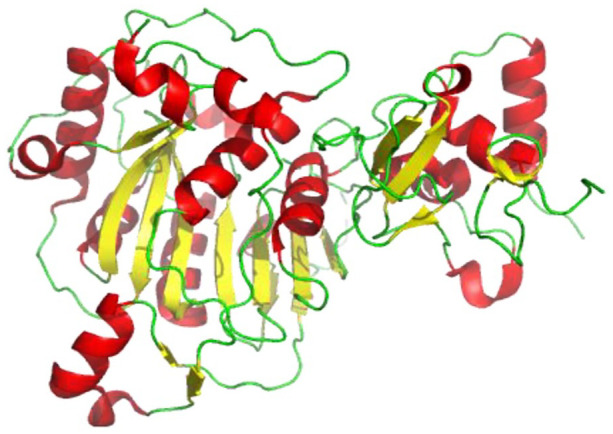
Cartoon representation of SARS-CoV-2 nsp13 structure showing loops (green), β-sheets (yellow), and helices (red) (PDB 6ZSL).

Cartoon representation of SARS-CoV-2 nsp13 structure showing loops (green), β-sheets (yellow), and helices (red) (PDB 6ZSL).