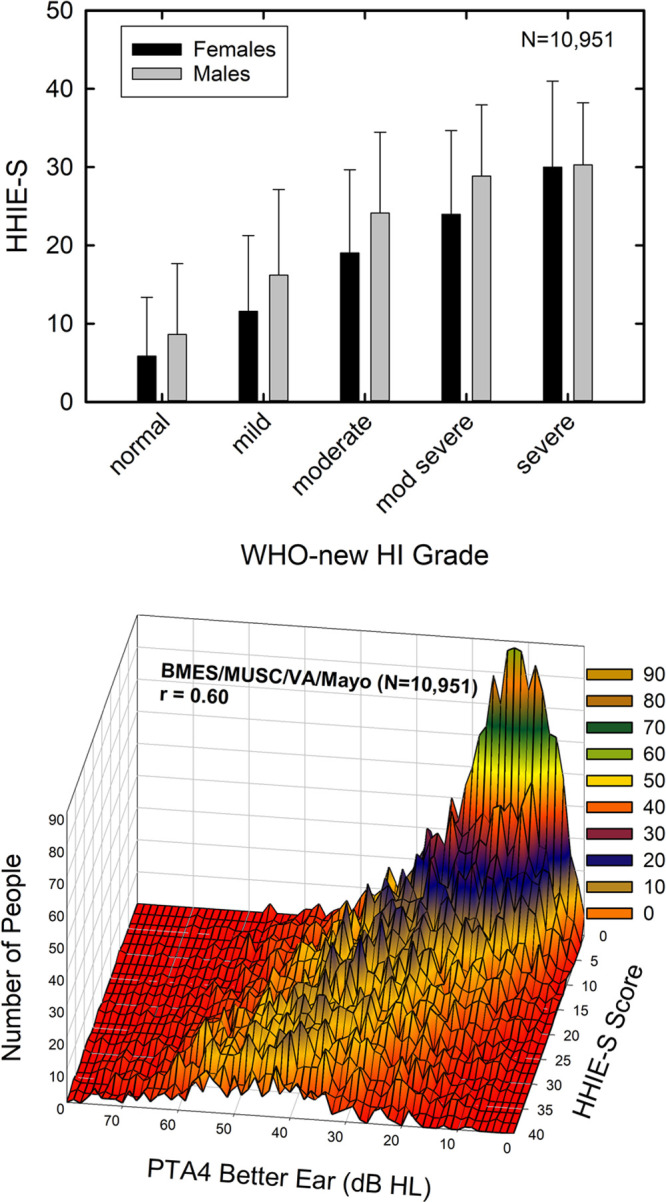
Fig. 1.

The top panel shows mean HHIE-S scores for the pooled dataset (N = 10,951) when grouped by gender (females, black bars; males, gray bars) and WHO-new hearing-impairment grade (Stevens et al. 2013). Error bars represent 1 standard deviation above the mean. The bottom panel shows the same HHIE-S data as the top panel but as a contour plot with better-ear PTA4 in dB HL along the X-axis. The color scale represents the number of individuals counted with each PTA4/HHIE-S combination. HHIE-S, Hearing Handicap Inventory for the Elderly-Screener.
