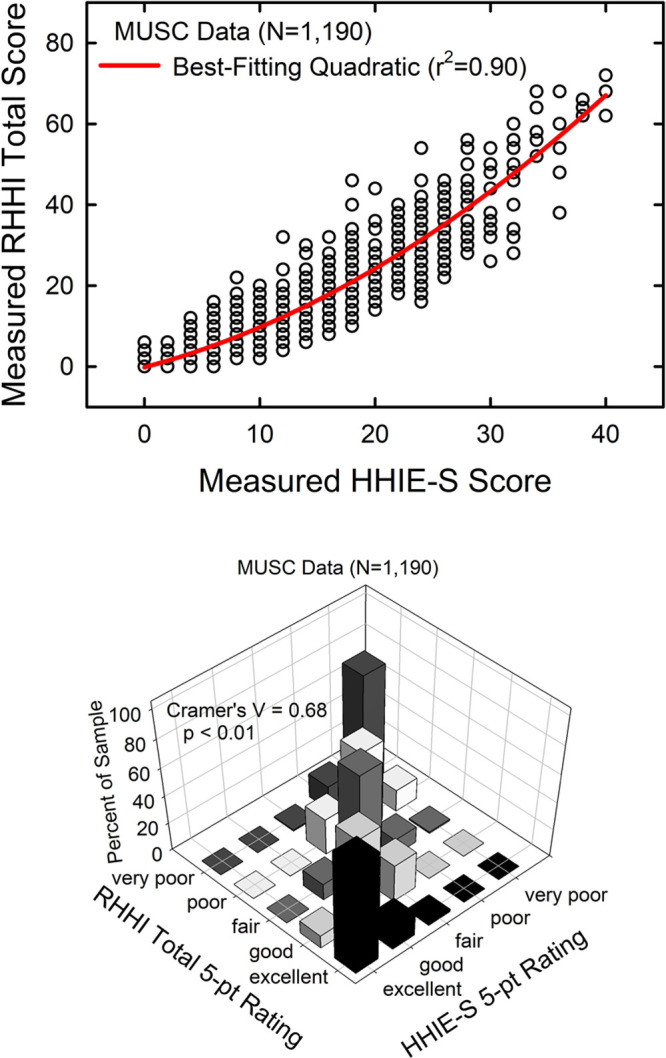
Fig. 9.

The top panel illustrates the transfer function from the HHIE-S score to the RHHI-Total score for the MUSC dataset. The red solid line is the best-fitting quadratic function. The bottom panel provides a three-dimensional illustration of the cross-tabulation of the two 5-point auditory wellness scales, one based on the HHIE-S and the other on the RHHI-Total scores. HHIE-S, Hearing Handicap Inventory for the Elderly-Screener; MUSC, Medical University of South Carolina; RHHI, Revised Hearing Handicap Inventory.
