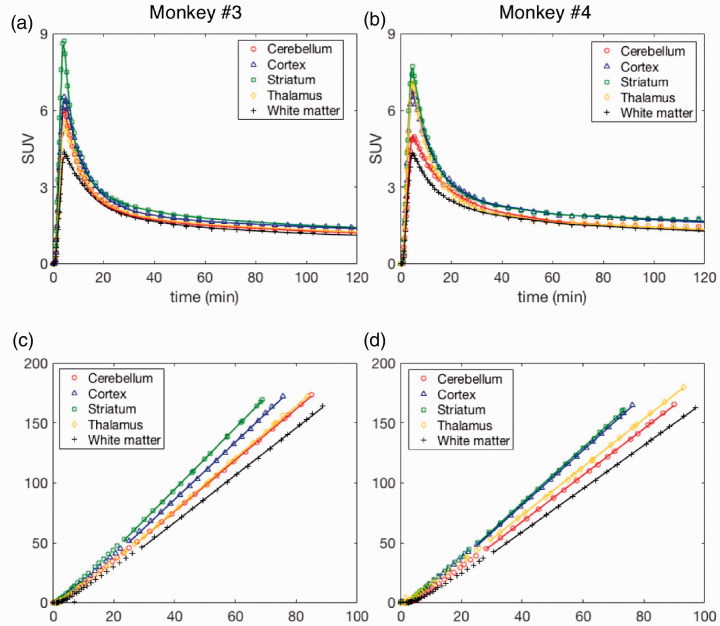
Figure 2.
[18F]3F4AP kinetics in different brain regions of Monkeys 3 and 4. (a and b) Time-activity curves and 2T4k model fits. (c and d) Logan plots using a 30 min t* and corresponding to brain time-activity curves shown in a and b. a and c show data acquired from Monkey 3, while b and d are from Monkey 4. For each monkey, data shown correspond to a single baseline study.

