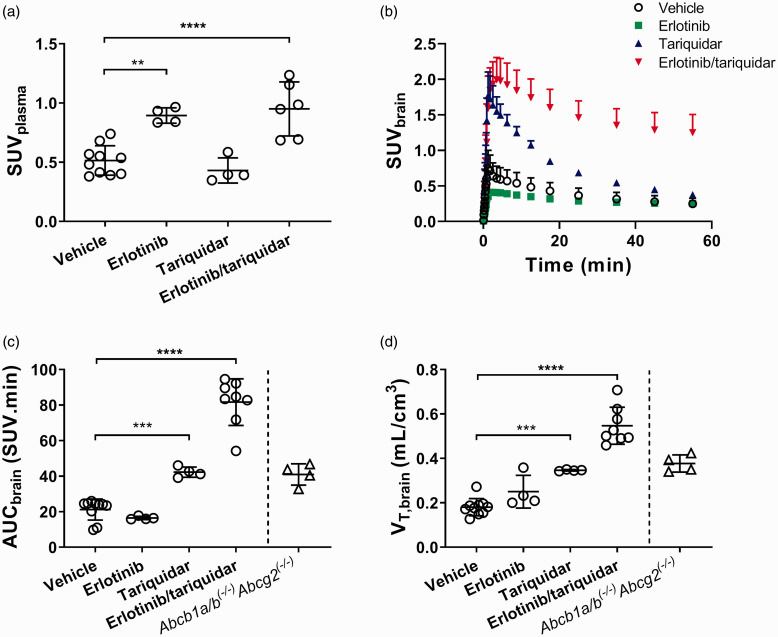
Figure 1.
Kinetics of [11C]erlotinib in mice. Total radioactivity concentration in venous plasma collected at the end of the PET scan, measured in a gamma counter in all examined mouse groups (a). Time-activity curves (mean ± SD) in whole brain (b), AUCbrain values (c) and VT,brain values (d) for all examined mouse groups. For comparison, AUCbrain and VT,brain values are also shown for Abcb1a/b(−/−)Abcg2(−/−) mice measured in a previous study.17 **p < 0.01; ***p < 0.001; ****p < 0.0001, one-way ANOVA with Dunnett’s multiple comparisons test.

