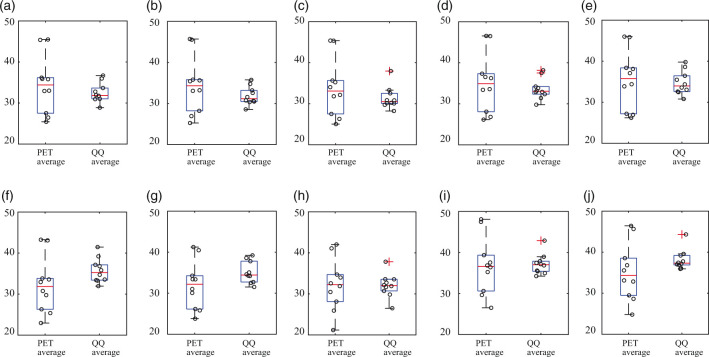
Figure 3.
OEF comparison in cortical gray matters (a–e), white matter (f), and deep gray matters (g–j) among PET and QQ average. No significant difference was found between PET and QQ (p > 0.12, paired t-test). The unit in y-axis is %. Red line, blue box, black whisker, and red cross, black circle indicates median value, interquartile range, the range extending to 1.5 of the interquartile range, outlier beyond the whisker range, and individual subject value.

