Figure 2.
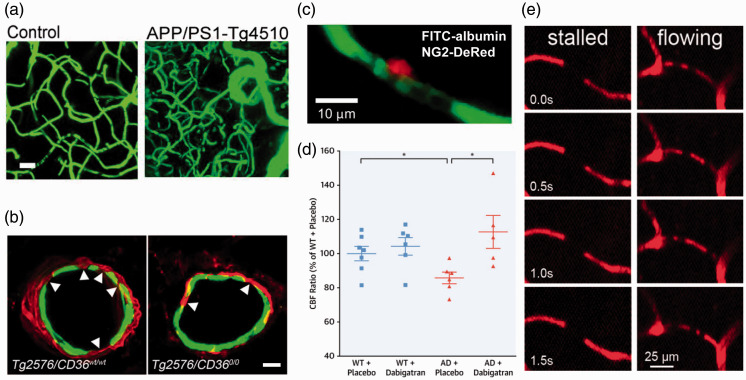
Mechanisms contributing to CBF reductions in mouse models of Alzheimer’s disease. (a) Images from 15 month old WT (left) and APP/PS1-Tg4510 mice (right; overexpresses mutant APP and mutant tau), showing clearly increased vascular volume in this AD mouse model containing both APP and tau-related mutations (Scale bar, 20 μm).140 (b) Fragmentation of smooth muscle cells (arrows) along a cortical arteriole in Tg2576 mice (left image), which is attenuated by CD36 deletion (right image) (Scale bar, 10 μm; anti-α-actin: green, anti-Aβ: red).168 (c) Example image of a pericyte (red) constricting around a cortical capillary (blood plasma shown in green), with blood cell flow blocked, from an AD mouse.157 (d) Cerebral perfusion was maintained in TgCRND8 mice treated with dabigatran.159 (e) Image sequences showing stalled (left panels) and flowing (right panels) capillaries, where the darker spots in vessels are due to unlabeled blood cells within the fluorescently-labeled blood plasma. Stalled capillaries, where blood cells do not move frame-to-frame, occurred at higher incidence in APP/PS1 mice, as compared to controls.97

