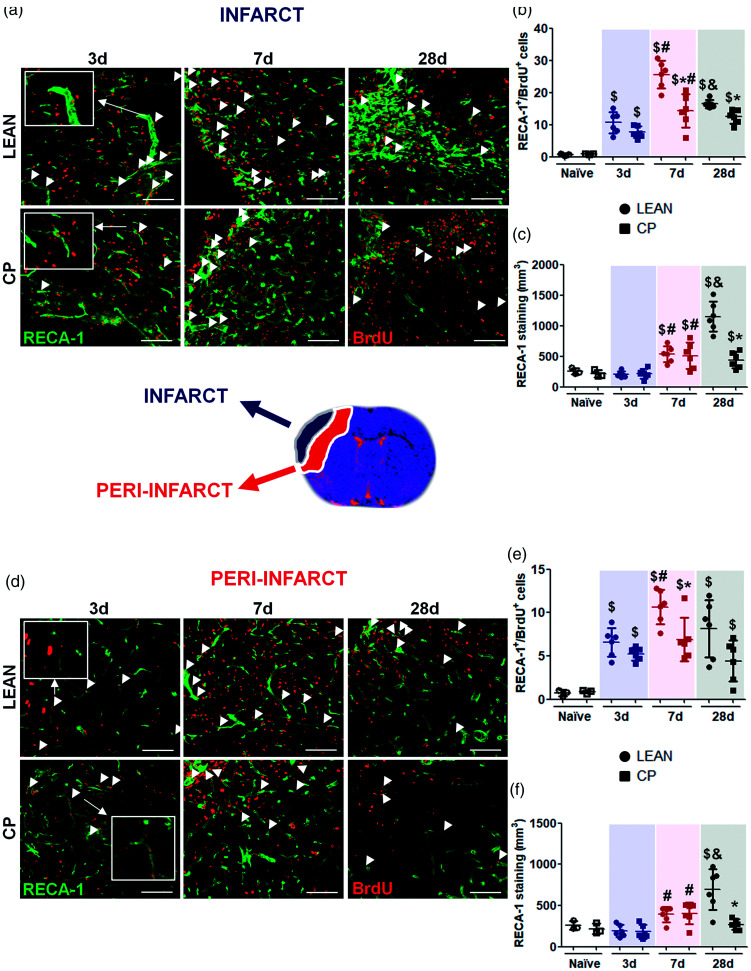
Figure 4.
Post-stroke angiogenesis in the core of the infarct and in the peri-infarct measured by immunofluorescence in lean and MS Cp old rats. (a, d) Representative images showing double positive cells for RECA-1 and BrdU in the infarct and peri-infarct in all the experimental groups (double positive cells are shown with white arrows). (b, e) Proliferation of new endothelial cells (RECA-1/BrdU double positive cells) in the cortex of naïve rats and in the infarct/peri-infarct in all the experimental groups. (c, f) Densitometry of the vascular density (expressed as µm3 of RECA-1 immunostaining) in the cortex of naïve animals and in the infarct/peri-infarct in all the experimental groups. N = 3 for naïve and n = 6 for ischemic animals per experimental group and time point. Data are expressed as mean±SD. $p < 0.05 vs Naïve; *p < 0.05 vs Lean; #p < 0.05 vs 3d; &p < 0.05 vs 7d, Mann Whitney test. Scale bar: 50 µm.

