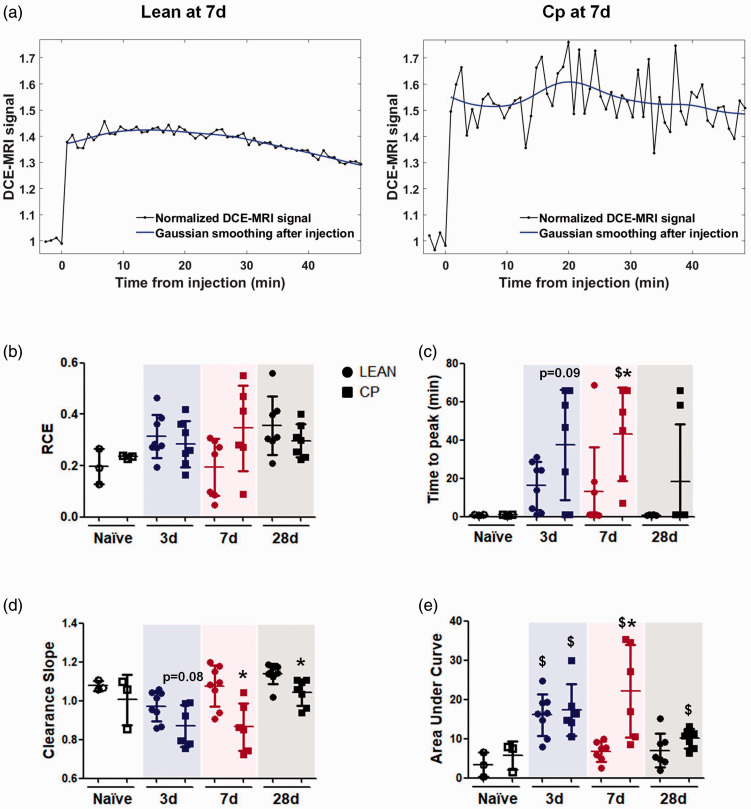
Figure 7.
Vascular function after cerebral ischemia in lean and MS Cp old rats. (a) Representative curves of the DCE-MRI analysis of vascular function in lean/Cp rats at 7d after tMCAO. (b) Relative contrast enhancement signal (RCE; peak) in naïve and ischemic lean/Cp rats at 3, 7 and 28d after stroke. (c) Time to peak (min) of the CA in naïve and ischemic lean/Cp rats at 3, 7 and 28d after stroke. (d) Clearance slope of the CA’s curve (ratio between the average signal of the first 5 frames and the last 5 frames after the gadolinium injection) in naïve and ischemic lean/Cp rats at 3, 7 and 28d after the surgery. (e): Area under the curve during the DCE-MRI acquisition time (60 repetitions) in naïve and ischemic lean/Cp rats at 3, 7 and 28d after tMCAO. N = 3 for naïve animals and n = 6–8 for the rest of experimental groups and time point. Data are expressed as mean±SD. $p < 0.05 vs Naïve; *p < 0.05 vs Lean, Mann Whitney test.

