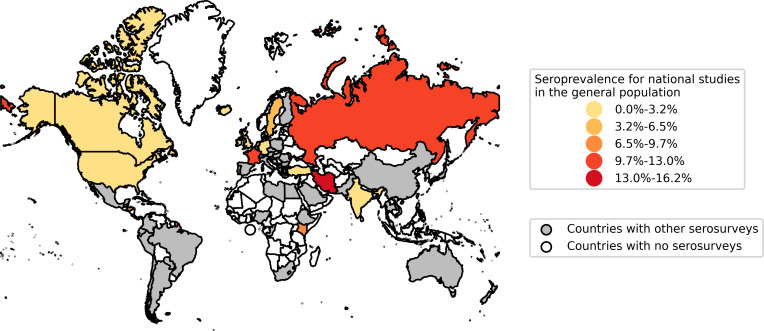
Fig 2. Map of national seroprevalence studies reporting population-wide estimates.
Countries with national-level seroprevalence studies reporting population-wide estimates are coloured on the map, based on the seroprevalence reported in the most recent such study in each country. Countries with no such national serosurveys but with “other serosurveys” are coloured in grey; this includes local and regional studies, as well as studies in specific populations. Map data reprinted from Natural Earth under a CC BY license, with permission from Natural Earth, original copyright 2009.

