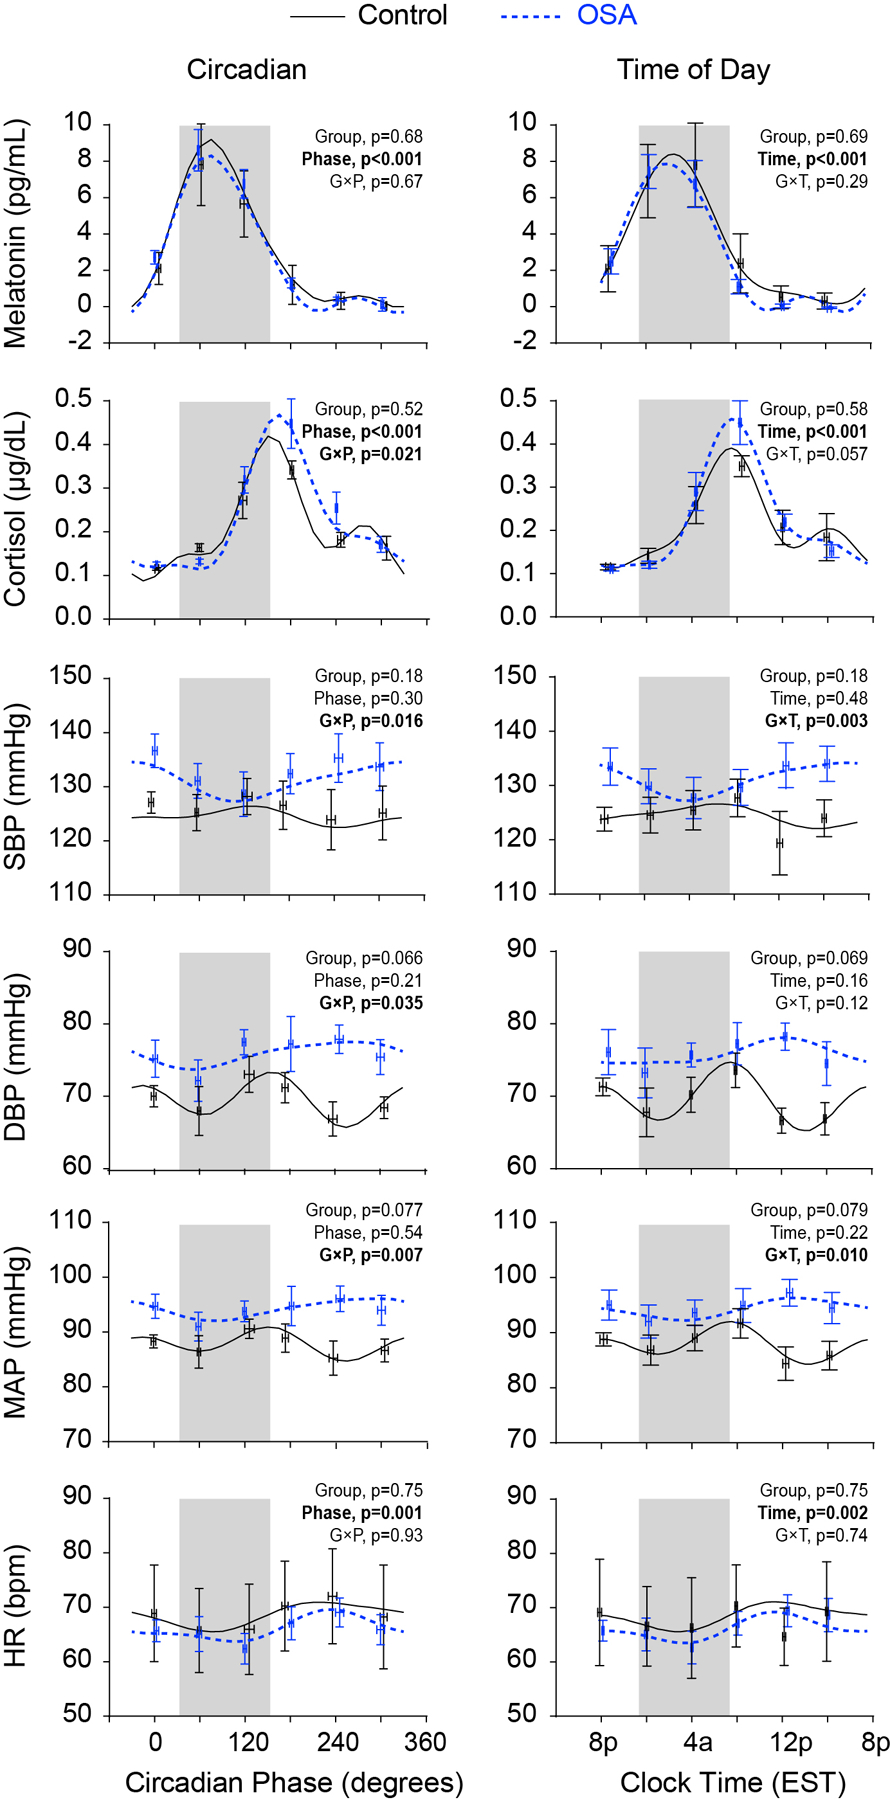
Fig. 2.

Rhythms with respect to circadian phase and external time: melatonin, cortisol, systolic blood pressure (SBP), diastolic blood pressure (DBP), mean arterial pressure (MAP) and heart rate (HR). Raw observed values are first binned by circadian phase (60° bins starting at 0°) or time-of-day (4 h bins starting at 8pm) within participant. These data are then averaged within group, and plotted as mean ± SEM (OSA, n=7 for endocrine variables, otherwise n=6; Control, n=4). Grey shading indicates the average self-selected sleep time across both groups (33°−153° on the left with 0° at DLMO, and 11:20pm-7:20am on the right). The cosinor model fits are also shown for each variable and group; p values for the fixed effects are shown in each panel.
