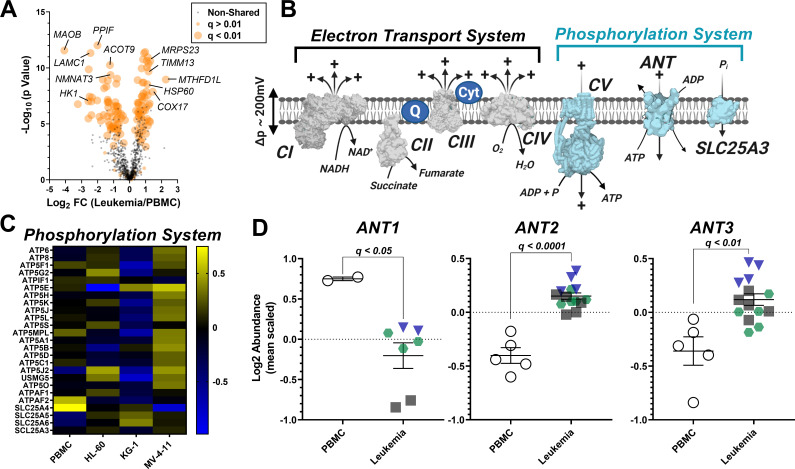
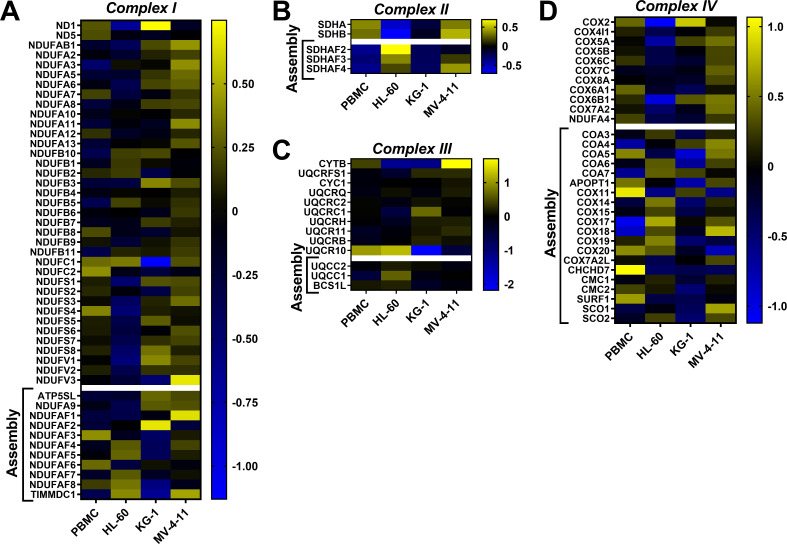
Figure 4. Analysis of mitochondrial proteome reveal disparate expression of ANT isoforms in leukemia.
TMT-labeled nLC-MS/MS was performed on mitochondrial lysates from each cell type. (A) Volcano plot depicting changes in proteome between leukemia cell lines and PBMC with mitochondrial proteins shown in orange. Significance is indicated by size of each circle with changes in significance (p<0.01) represented by larger circles. (B) Schematic depicting the OXPHOS system with enzymes integral to the ETS shown in gray and the phosphorylation system shown in blue. (C) Heat map displaying the common differentially expressed proteins across the phosphorylation system of leukemia and PBMC. Data are displayed as Log2 protein intensity of all quantified master proteins. (D) Comparison of log2 abundance of ANT isoforms in leukemia and PBMC; n = 4–6 mitochondrial preparations per cell lines. Data are presented as mean ± SEM and analyzed by unpaired t-tests with multiple hypothesis correction (Padjusted, Benjamini Hochberg FDR correction, significance cutoff of q < 0.1).


