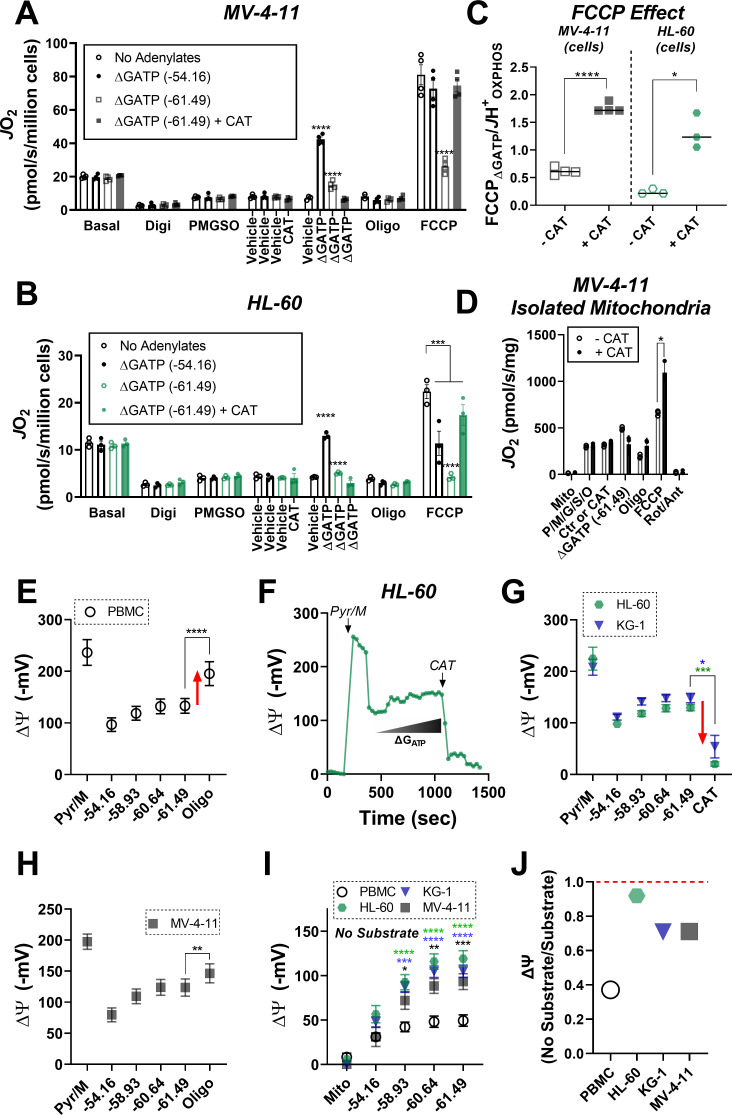
Figure 5. ETS flux inhibition by ΔGATP links to matrix ATP consumption in leukemia.
(A–B) OXPHOS kinetics (via CK clamp) were assessed in the absence of adenylates or in the presence of minimal ΔGATP (−54.16), maximal ΔGATP (−61.49), or maximal ΔGATP + CAT (Carboxyatractyloside; ANT inhibitor). Comparison of OXPHOS kinetics in MV-4–11 (A) and HL-60 cells (B). (C) Ratio of FCCP ΔGATP to JH+OXPHOS with and without CAT in MV-4–11 and HL-60 cells. (D) OXPHOS kinetics measured in the presence of CAT in mitochondria isolated from MV-4–11. (A–D) n = 4 independent experiments per cell type. (E) Mitochondrial membrane potential (ΔΨ) in PBMC isolated mitochondria across a ΔGATP span, followed by CV inhibition with oligomycin; n = 8 independent experiments. (F) Representative trace of ΔΨ in HL-60 isolated mitochondria across a ΔGATP span, followed by ANT inhibition with CAT. (G) Quantification of the experiment depicted in panel F in HL-60 and KG-1 isolated mitochondria; n = 3 independent experiments. (H) Mitochondrial ΔΨ in MV411 isolated mitochondria across a ΔGATP span, followed by CV inhibition with oligomycin; n = 9 independent experiments. (I) Mitochondrial ΔΨ in isolated mitochondria across a ΔGATP span in the absence of any carbon substrates; n = 4 independent experiments. (J) Ratio of group mean ΔΨ generated at ΔGATP = −61.49 kJ/mol in the absence versus presence of carbon substrates (pyruvate, malate). Data are presented as mean ± SEM and analyzed by two-way ANOVA (A–B, I) or paired t-tests (C–E, G–H). *p<0.05, **p<0.01, ***p<0.001, ****p<0.0001.


