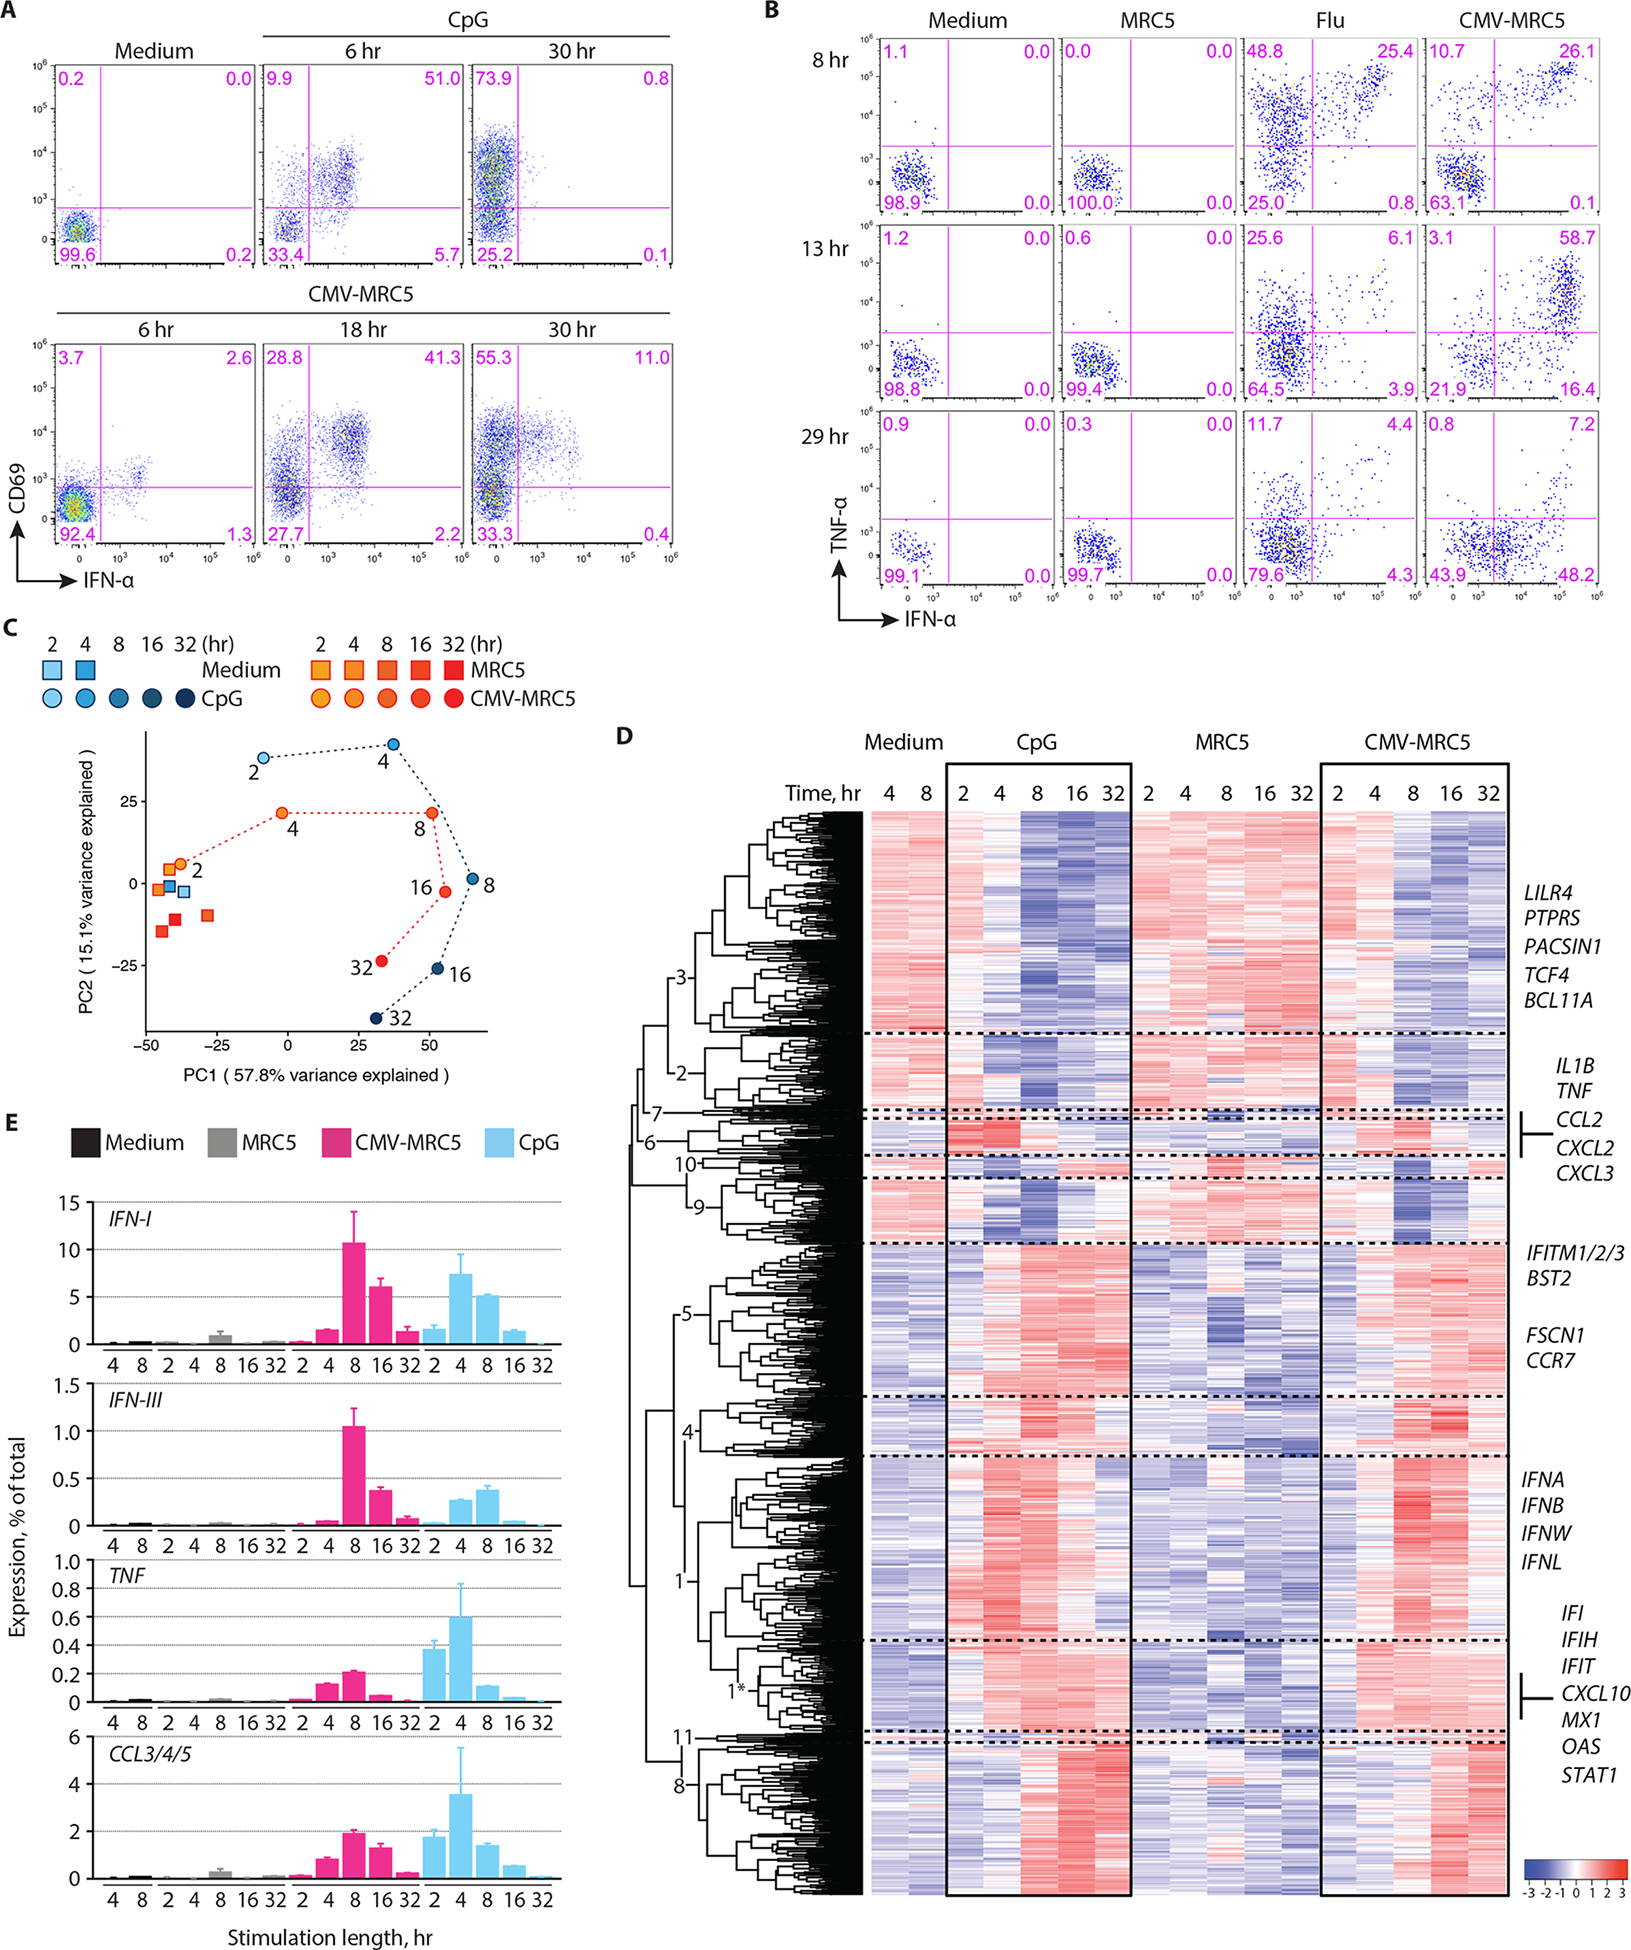
Fig. 3. Kinetics and magnitude of pDC activation by CMV-infected cells.

(A) The expression of IFN-α and CD69 in pDCs that were incubated with CpG or cocultured with CMV-infected MRC5 cells (CMV-MRC5) for the indicated time periods.Representative of 4 experiments.
(B) The expression of IFN-α and TNF-α in pDCs that were incubated with influenza virus (flu) or cocultured with uninfected or CMV-infected MRC5 cells for the indicated time periods. Representative of two experiments.
(C-E) Whole-transcriptome analysis of pDC activation. pDCs were incubated with MRC5, CMV-MRC5 or CpG for 2, 4, 8, 16 or 32 hours or in medium only for 4 or 8 hours, sorted and analyzed by RNA-Seq. All data represent averages of three biological replicates.
(C) Principal component (PC) analysis of expression profiles in each condition and time point (different time points of each activation conditions are connected by dashed lines). The fraction of variance captured by each PC is indicated.
(D) Expression dynamics of genes that were differentially expressed during activation by both CMV-MRC5 and CpG. Shown is the hierarchically clustered heatmap of mean relative expression intensities, with cluster numbers indicated (see Table S1). A subcluster of cluster 1 that shows early stable upregulation upon activation is indicated with an asterisk. Select genes within each cluster are listed.
(E) The fraction of transcripts encoding soluble factors in activated pDCs. Shown are cumulative percentages of transcripts for the indicated cytokines and chemokines out of the total transcriptome in the indicated stimulation conditions and time points (mean ± S.D. of triplicate samples).
