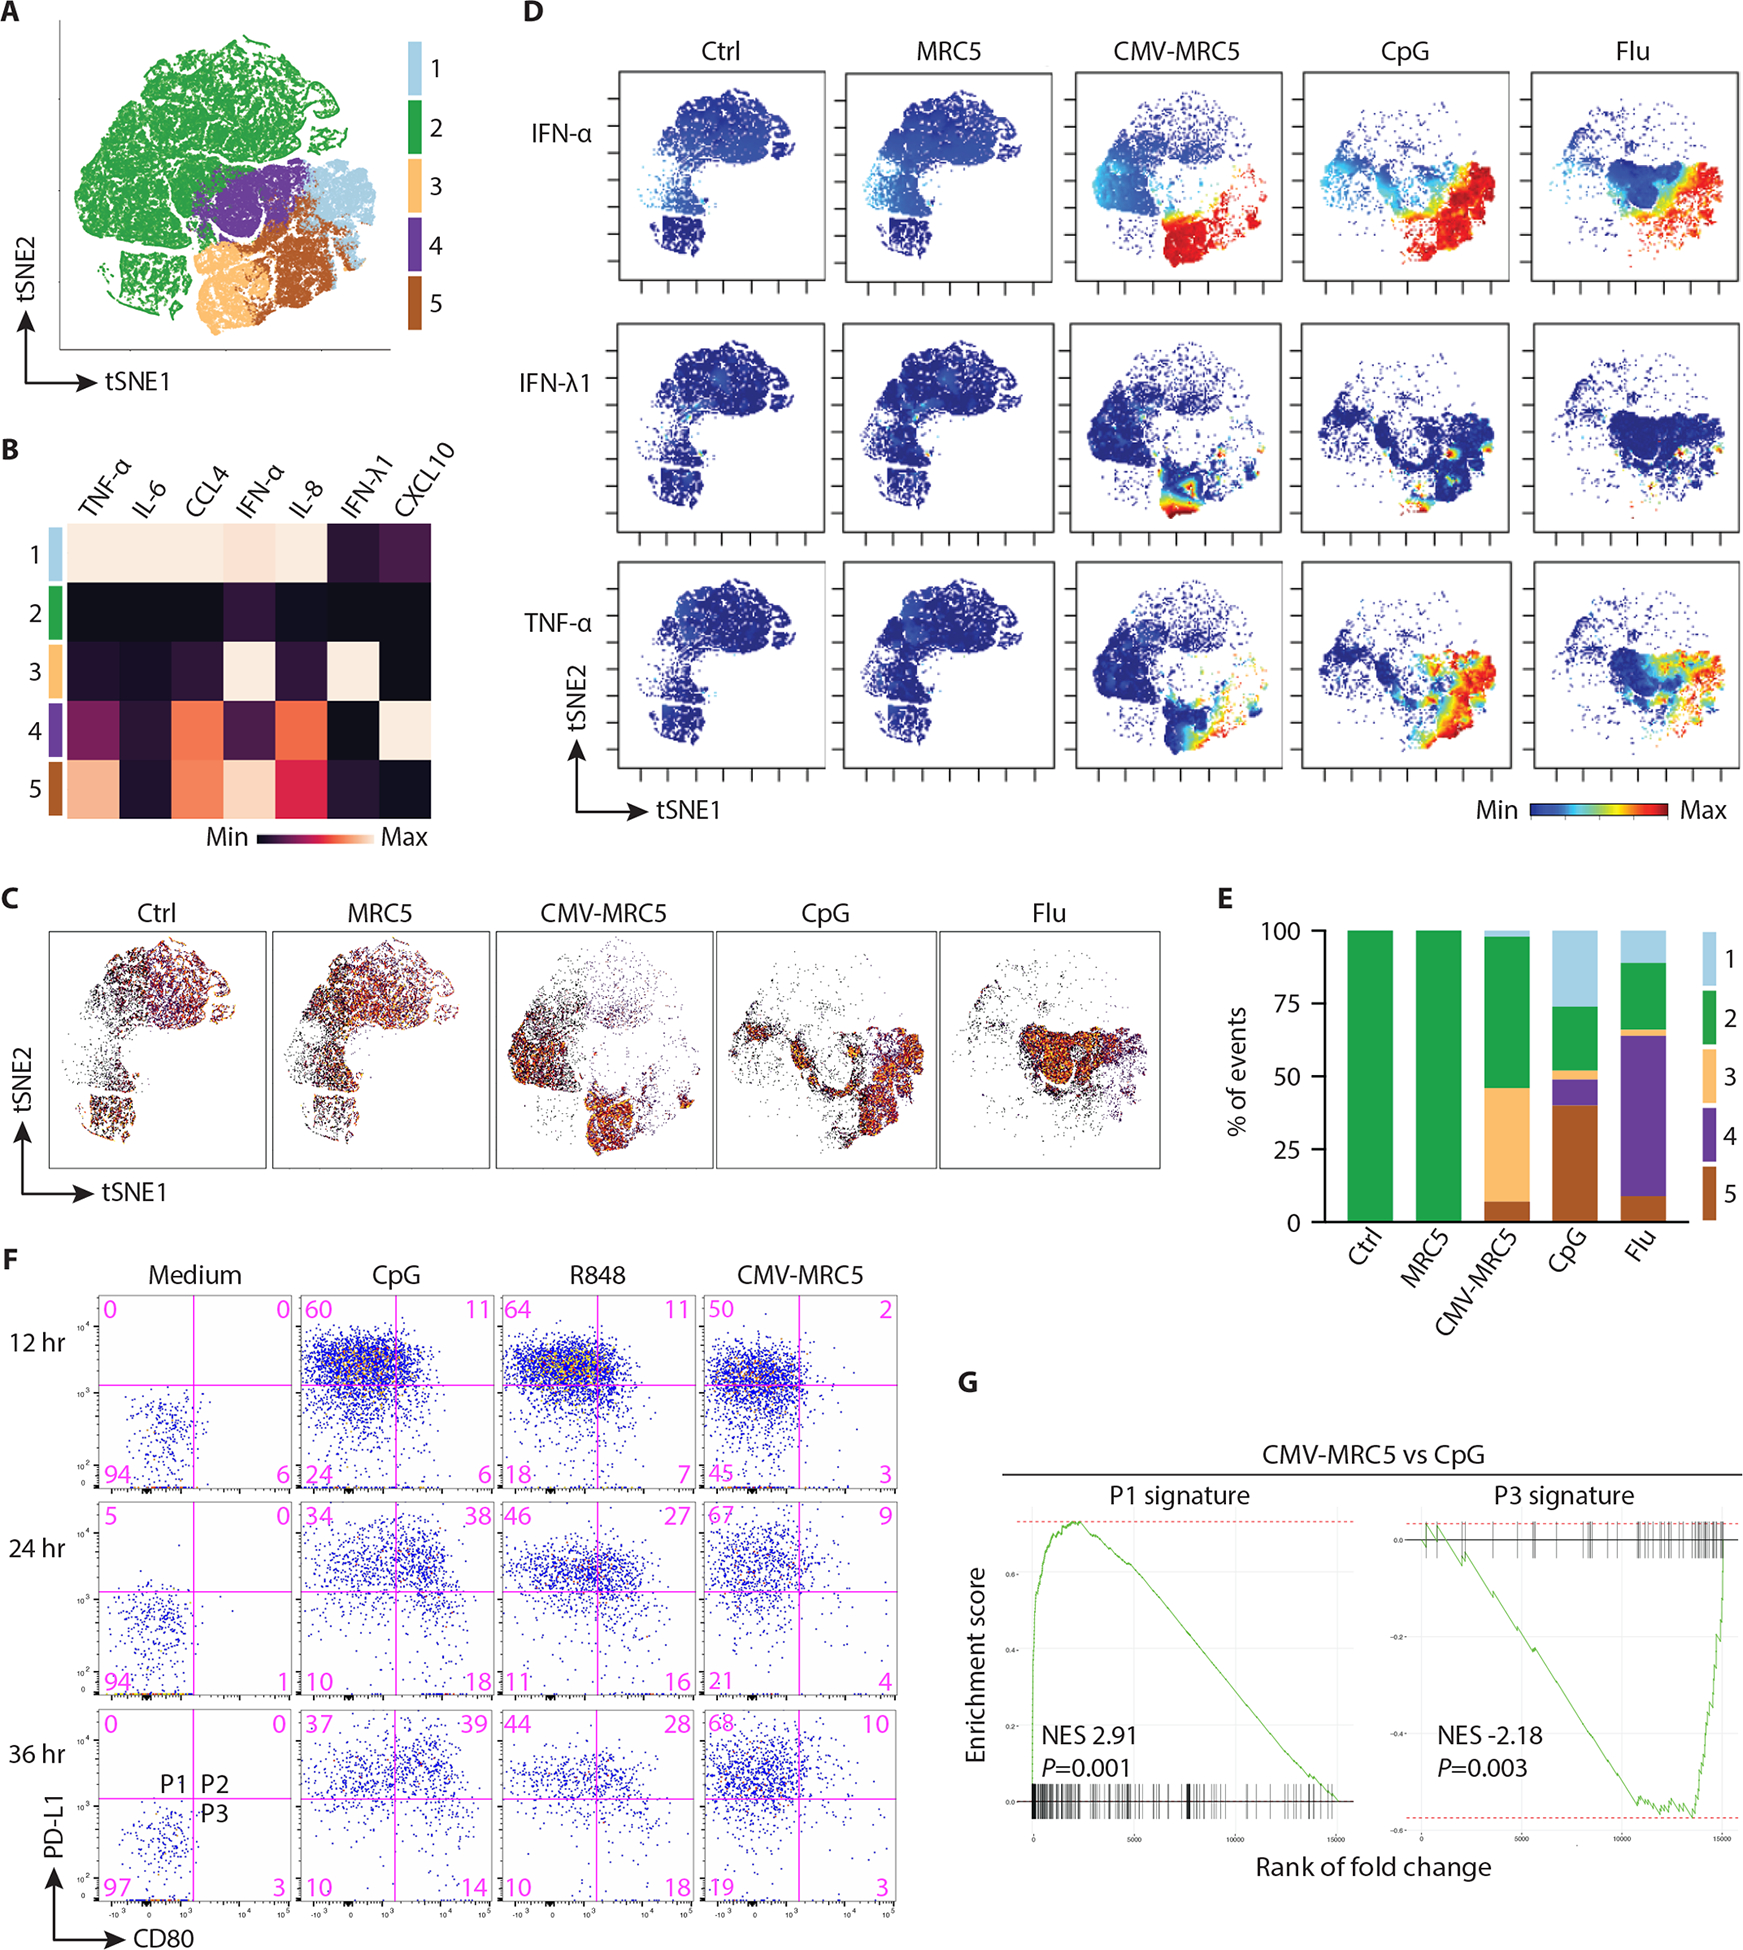
Fig. 5. CMV-infected cells elicited a distinct IFN-focused pDC response.

(A) tSNE plot showing equal numbers of pDC pooled from each of the early (9–11 hours) time point stimulation conditions and clustered based on cytokine expression alone; the resulting clusters are indicated bby colors.
(B) Heatmap of cytokine expression in pDC clusters defined in panel A. Highest and lowest positive cell fractions for each cytokine were set to the maximum and minimum, respectively.
(C) tSNE plots showing the relative distribution of cells under each stimulation condition.
(D) Relative expression of indicated cytokines within the pDC population visualized on a tSNE plot.
(E) The relative frequency of cell clusters in each stimulation condition.
(F) Phenotypic diversification of pDCs in response to CpG, R848 or CMV-MRC5. Enriched pDCs were stimulated with TLR ligands or CMV-MRC5 for the indicated times and analyzed by flow cytometry to define the highlighted P1–P3 populations. Representative of 4 experiments.
(G) Transcriptional signatures of pDC subpopulations in activated pDCs. Gene set enrichment analysis (GSEA) was performed on pDCs activated by CMV-MRC5 compared to CpG for 32 hours. Shown is the normalized enrichment score (NES) and enrichment p-value of P1 and P3 subpopulation signatures derived by the analysis of RNA-Seq data from (42).
