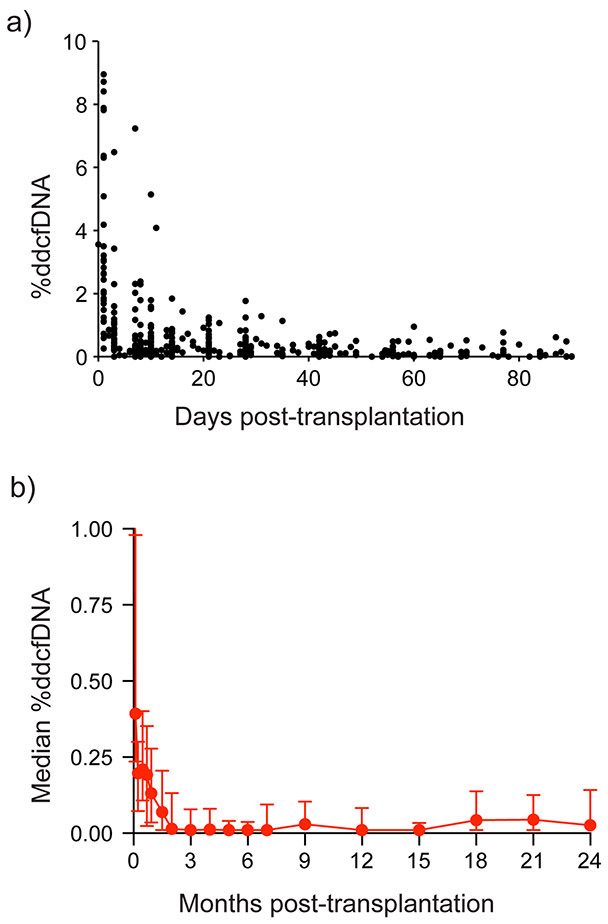
Figure 2: %ddcfDNA exponential decay early after transplant and longitudinal %ddcfDNA measures after transplant.
A) Exponential decay of %ddcfDNA after transplant. Black dots represent individual %ddcfDNA measures. Decay parameters are in Table IIIb in the Supplement.
B) Median %ddcfDNA overtime. Box-and-whisker plot is the median value (red dot), the lower quartile and the upper quartile of a given set of data. Median values are in Table IIIc in the Supplement.

