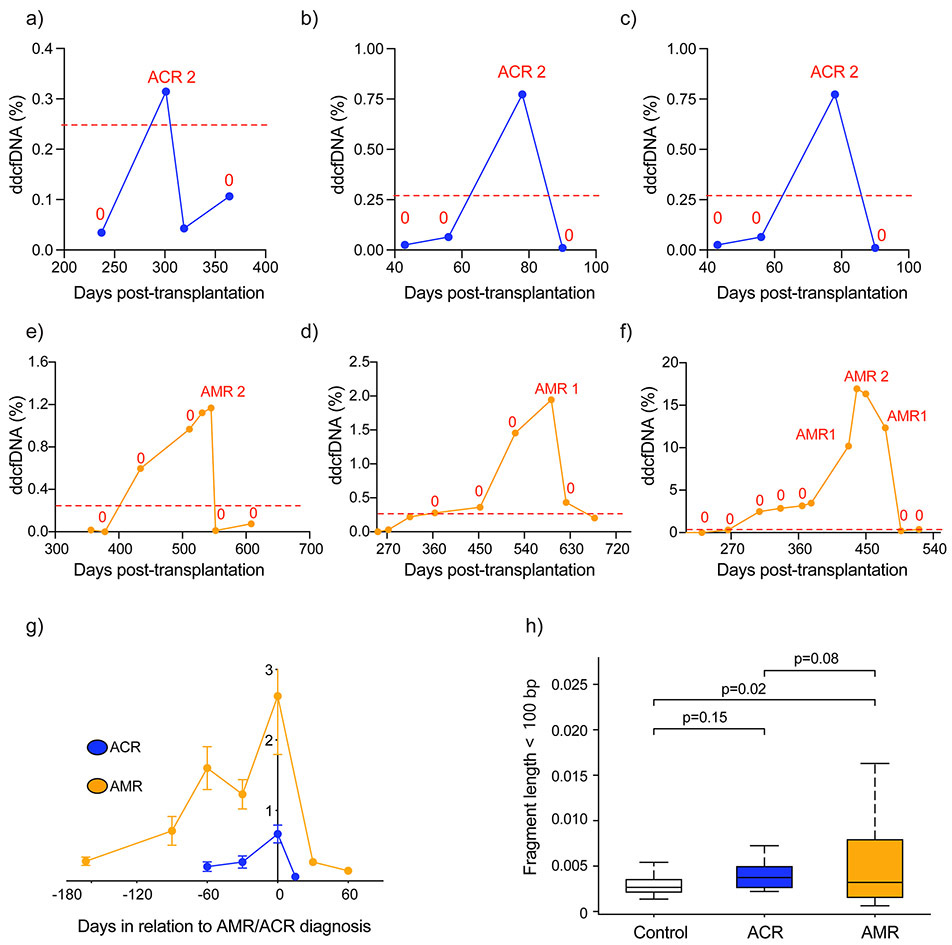
Figure 5: Distinct %ddcfDNA patterns in AMR and ACR.
a – c %ddcfDNA against time plots for prototype subjects with acute cellular rejection, “0” = ACR grade 0 or grade 1 and pAMR0
d – f %ddcfDNA against time plots for prototype subjects with antibody-mediated rejection. “0” = ACR grade 0 or grade 1 and pAMR0
g. Trends of %ddcfDNA measures in all patients preceding a histopathologic diagnosis of AMR or ACR; mean and standard deviations are shown. For AMR, there is a longer lead-time and larger quantitative ddcfDNA release of ddcfDNA prior to diagnosis. In addition, 12/15 cases of AMR had elevations of ddcfDNA preceding the clinical diagnosis. In ACR the ddcfDNA elevations preceding clinical diagnosis are rarer (2/17), lower quantitatively and are detected for a shorter time preceding overt diagnosis.
h. Different %ddcfDNA characteristics based on cfDNA length in ACR and AMR. Short DNA fragments were defined based on total read length < 100bp. In AMR, the % short cfDNA fragments is much higher than in ACR or controls without rejection.

