
Figure 13.
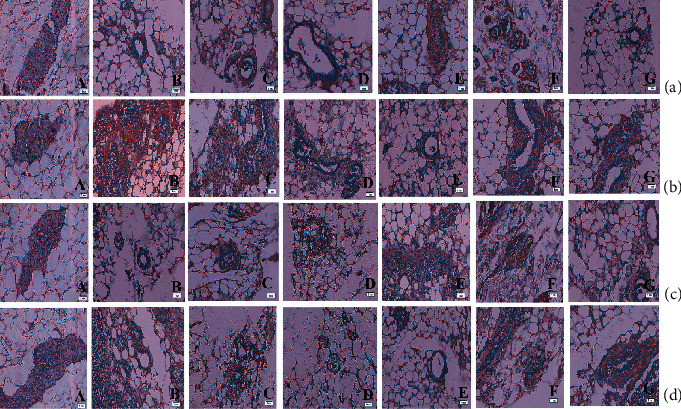
The immunohistochemical analysis of the (a) p53, (b) Bcl2, (c) Bax, and (d) MMP9 expressions in the mammary tissues of different groups of rats: (A) the normal control, (B) carcinogen control, (C) 25 mg/kg complex-treated rats, (D and E) 50 and 100 mg/kg complex-treated rats, (F) 50 mg/kg fluvastatin-treated animals, and (G) 50 mg/kg ruthenium-treated animals. All images at 40x.