
Figure 9.
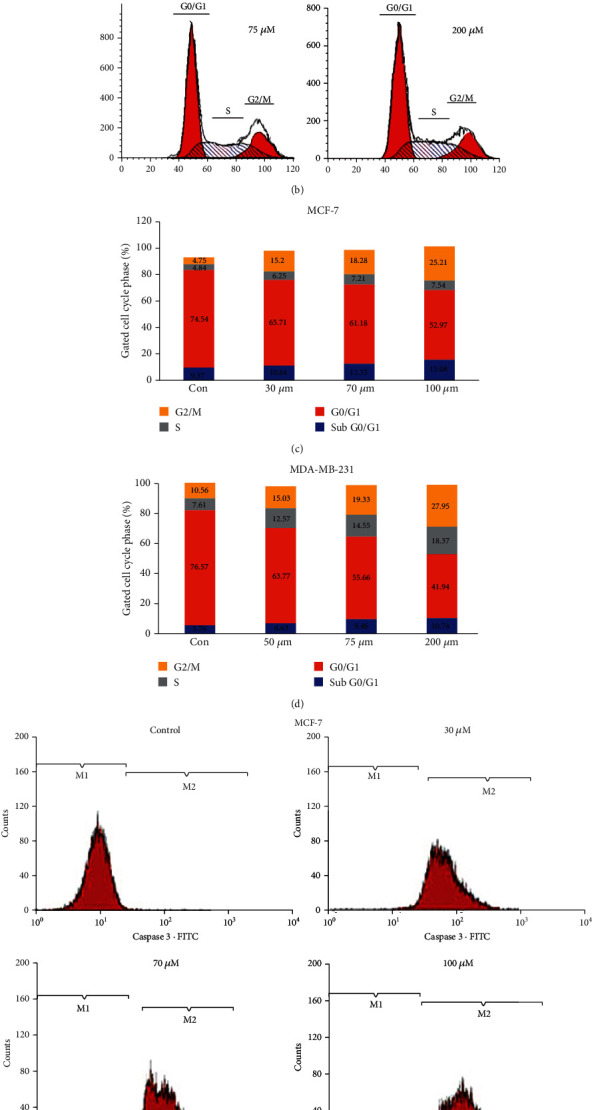
(a) Analysis of cell cycle phase distribution of MCF-7 cells after the treatment with the ruthenium-fluvastatin complex. (b) Analysis of cell cycle phase distribution of MDA-MB-231cells after the treatment with the ruthenium-fluvastatin complex. (c) Quantitative distribution of MCF-7 cells in different phases of the cell cycle. (d) Quantitative distribution of MDA-MB-231 cells in different phases of the cell cycle. (e) Expression of caspase-3 proteins in MCF-7 cells after 24 hours of treatment with the ruthenium-fluvastatin complex. (f) Expression of caspase-3 proteins in MDA-MB-231 cells after 24 hours of treatment with the ruthenium-fluvastatin complex.