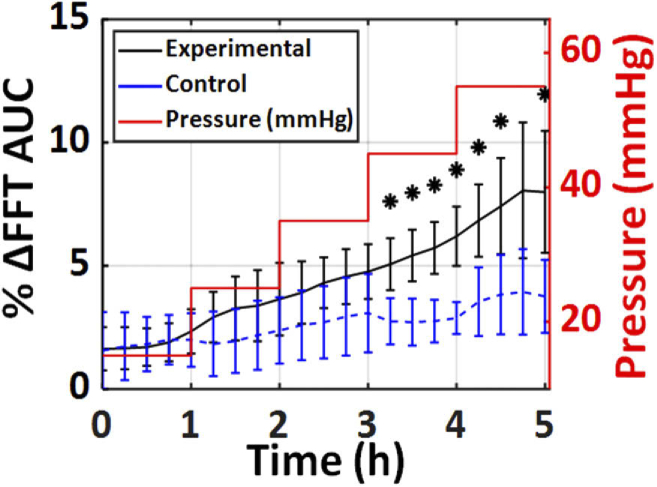
Fig. 7.
The mean percentage change in the AUC of the THz spectra, between 0.45 and 0.6 THz, in both the experimental and control groups is plotted. The red step profile shows the IOP of the experimental group over the 5 hours. In contrast, the IOP of the control group was held constant at 15 mmHg (not shown). The error bars represent ± standard deviation. The asterisks represent a significant difference between the experimental and control group with p < 0.05.

