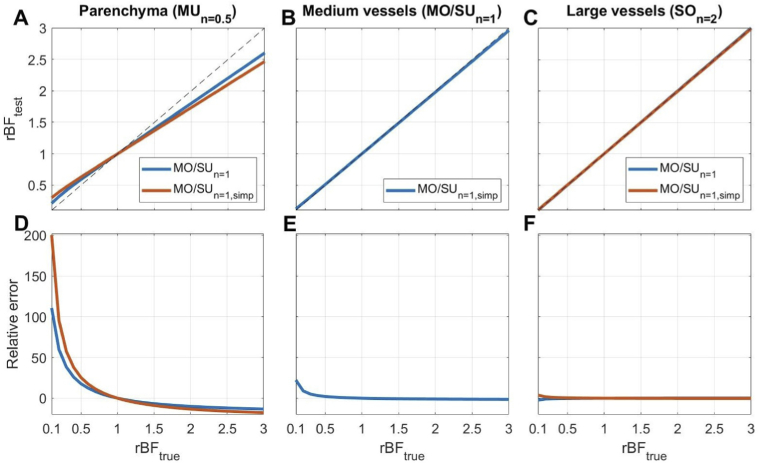
Fig. 2.
Relative error (in percent) resulting from using the model (blue) and its simplified version (orange). The form of and the value for the true models were defined according to the imaged vessel’s size as described in the Methods section. Other parameters were set as follows: =1, =1, =5 ms. We see an error upwards of 200%, which is caused by using the wrong form of the field correlation function to interpret speckle contrast in the parenchyma. In A-C, the identity line is shown in dashed gray.

