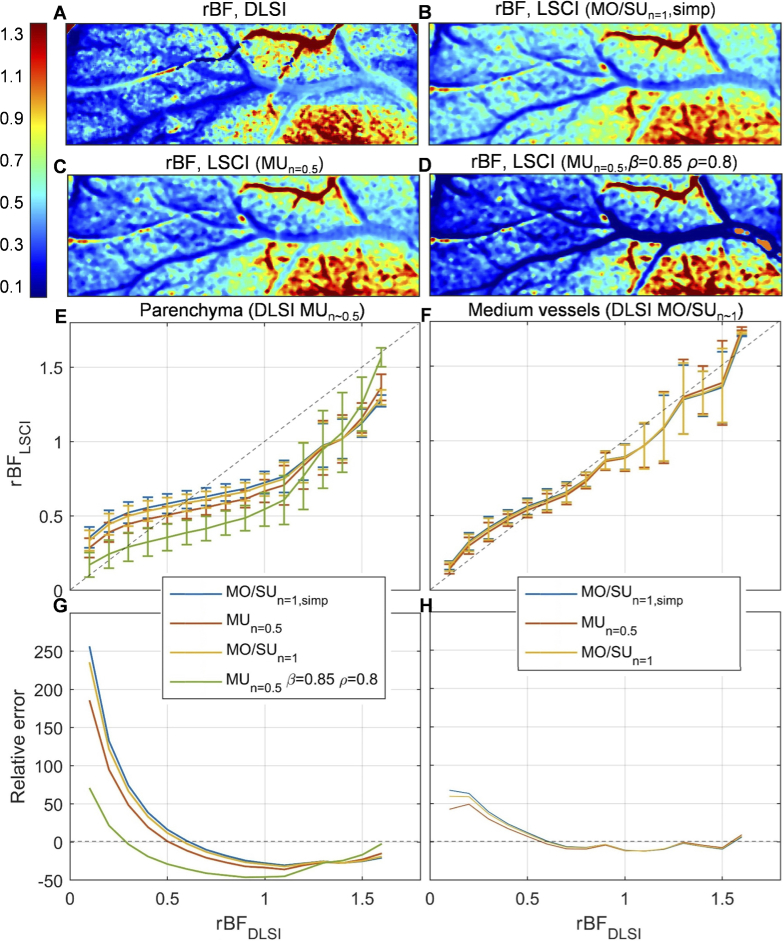
Fig. 5.
Experimental validation of the simulation results. (A)-(D) - in stroke compared to baseline calculated with DLSI and different LSCI models. It can be seen that conventional LSCI underestimates both the reduction (left side of the image) and increase (bottom right) in blood flow. Relative blood flow calculated using model with (panel C) provides a better estimate of flow reduction in parenchyma, without strong effect on larger vessels. Setting and in all pixels (panel D) leads to expected mixed results - more accurate rBF estimation in parenchyma is accompanied by severe errors in larger vessels, where there should be no static scattering. (E), (F) - as a function of . (G), (H) - relative error (in percent) calculated for the data presented in (E) and (F). Blue lines correspond to the conventionally used model, yellow and red to the and models respectively (), and the green line corresponds to the model with and .

