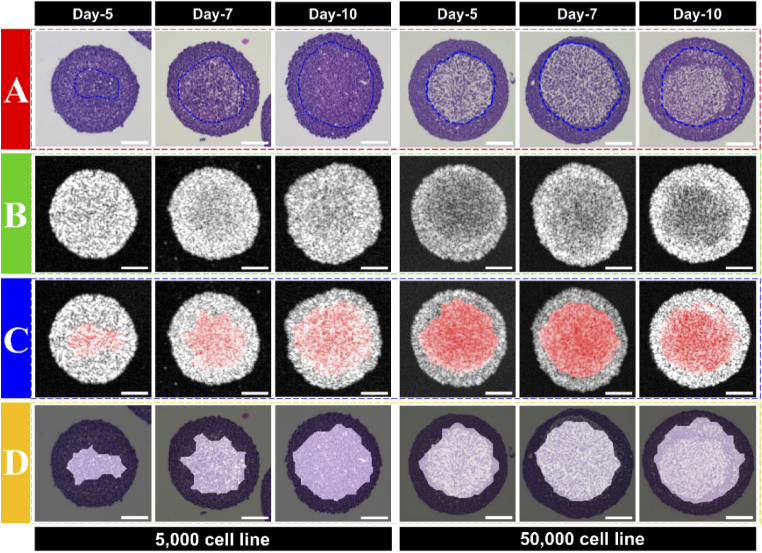
Fig. 6.
Comparison of necrotic regions based on optical attenuation contrast with histology images. (A) Histology of tumor spheroids on day-5, -7, and -10. (B) OCT intensity images. (C) Overlay the high attenuation coefficient region with OCT intensity images. (D) Overlay the high attenuation coefficient region with histology. Scale bars – 100 µm.

