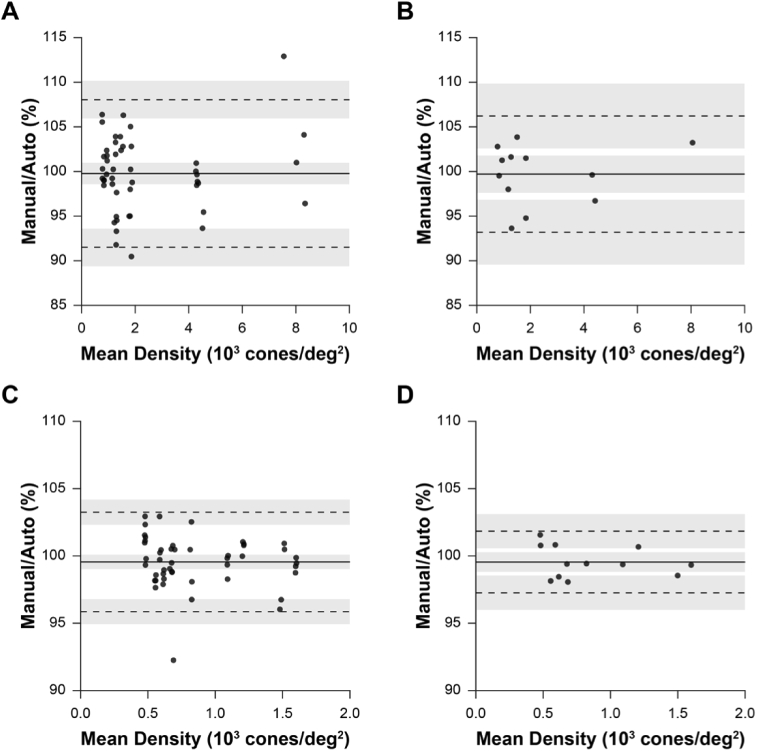
Fig. 6.
Differences in cone density estimates between manually and automatically generated images. (A) Bland-Altman plot of cone density in human subjects from every pair of ROIs created either automatically or manually (3 subjects’ datasets processed with 2 methods [manually and automatically] by 2 operators, 4 ROIs extracted per subject by another operator, each counted by 2 different operators: 3 × 2 ×2 × 4 ×2 = 96 total ROIs; n = 48 ROI manual v. automatic pairs). Bias: solid line; limits-of-agreement: dashed lines. (B) To improve data independence (measures were repeated on the same retinal location in A), cone density estimates were averaged between montage-generating operators and cone-counting operators so that each density comparison is derived from a unique retinal location (n = 12 manual v. automatic pairs). (C-D) Equivalent analysis as A-B, respectively, for 13-LGS datasets. We expect that 95% of observations would differ by less than ± 10% and 5% for humans and 13-LGS, respectively.

