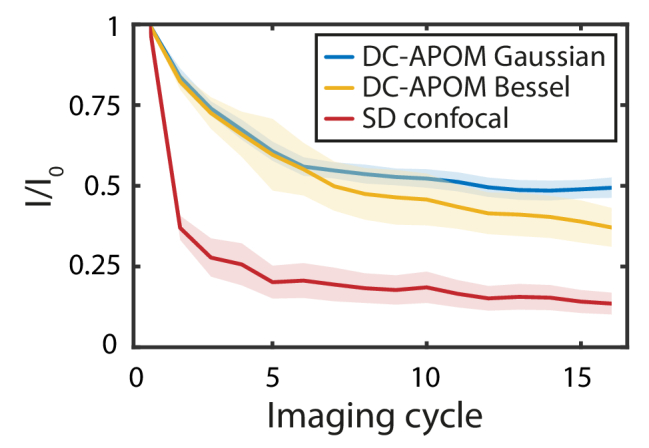
Fig. 3.

Photobleaching performance. Photobleaching is quantified using fluorescence intensity values I normalized to the first imaging cycle I0, for DC-APOM based on Bessel or Gaussian beams, and for spinning disk confocal. To compare the photobleaching, 3D image volumes of the same resolution were acquired using all imaging modalities, with the same signal-level in the images. Lines denote the mean of n = 10 biofilm volumes and the shaded area indicates the standard deviation.
