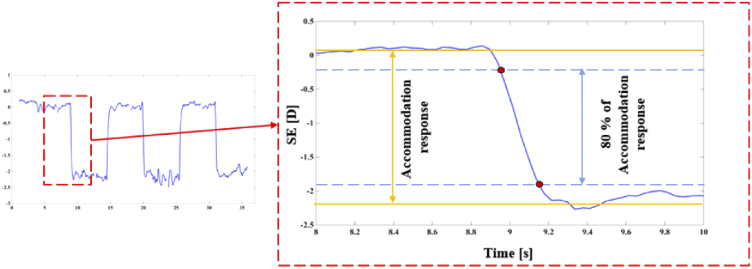
Fig. 5.
Threshold method: Solid blue curve represents SE during one accommodation event; yellow lines represent steady accommodation states calculated as the average across at least 2 seconds; dashed lines represent the 80% central section of the accommodation response (i.e., the difference between steady states). The studied parameters are calculated in the interval between the red dots included.

