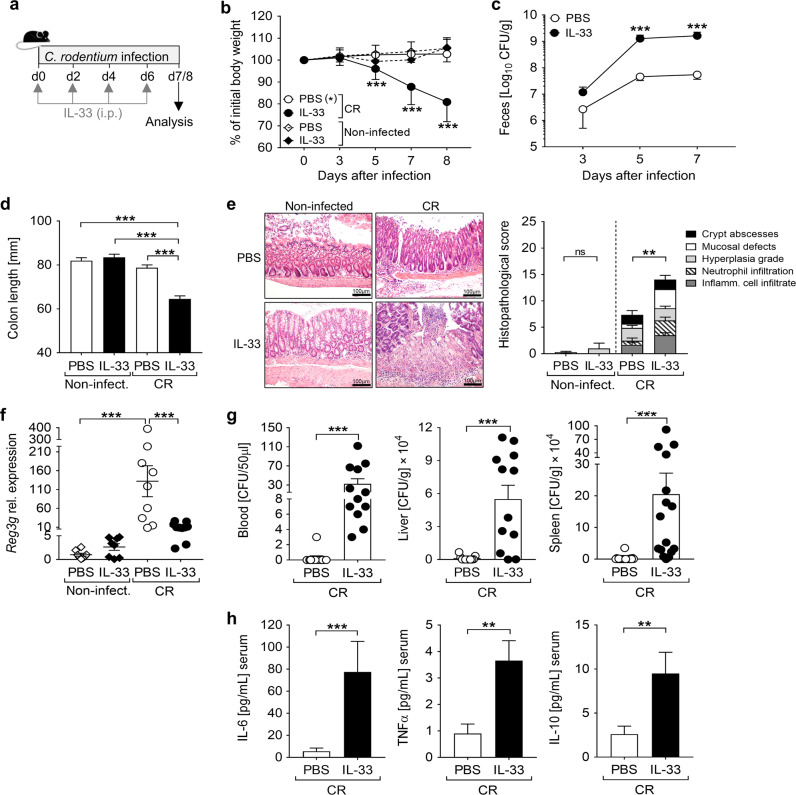
Fig. 3. Detrimental effect of IL-33 administration during C. rodentium infection.
a C57BL/6 mice were orally gavaged with CR on day 0. Non-infected and CR-infected mice received IL-33 or PBS (control groups) intraperitoneally on day 0, 2, 4, and 6 after infection. Mice were sacrificed before the body weight loss exceeded 20%. b Body weight was monitored daily during infection (n = 18–23 mice per group). Statistical analysis was performed using two-way ANOVA followed by Bonferroni’s post hoc test. c Bacterial load in feces assessed at the indicated time points after infection (n = 22–23 mice per group). Statistical analyses were performed using Mann–Whitney U test to compare groups at each time point. d Macroscopic score of colitis based on shortening of colon length (n = 18–23 mice per group). One-way ANOVA followed by Tukey’s multiple comparison test was used for statistical analysis. All data are presented as mean ± SEM and were pooled from seven independent experiments. e Representative pictures (scale bars 100 µm) of H&E-stained colon sections (left) and histopathological score (right). Bars show the mean ± SEM of each inflammatory parameter analyzed. Data from three independent experiments are shown (n = 8–10 mice per group). Statistical analyses were performed using Student’s t test to compare IL-33-treated groups with non-treated groups, respectively with or without infection. f Colonic Reg3g mRNA expression determined by qRT-PCR. Bars show the mean ± SEM of fold change induction over non-infected, non-treated group. One-way ANOVA followed by Tukey’s multiple comparison test was used for statistical analysis. Results from three experiments are shown. g Systemic bacterial distribution was assessed by plating whole blood and serial dilutions of homogenized tissues on MacConkey agar. Bars represent the mean ± SEM of data from three experiments. h In the same experiments, serum levels of inflammatory cytokines were measured via Luminex technology. Bars indicate the mean ± SEM of cytokine picograms per milliliters of serum (n = 11–12 mice per group). Statistical analysis was performed using Mann–Whitney U test. *P < 0.05; **P < 0.01; ***P < 0.001.

