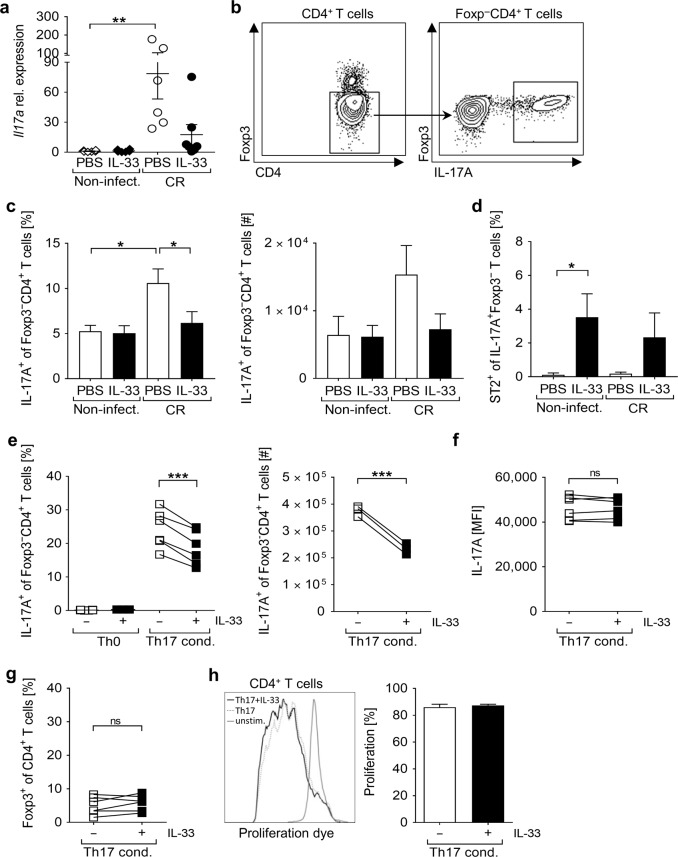
Fig. 6. IL-33 interferes with the differentiation of IL-17A-producing Th17 cells.
Mice were treated as described in Fig. 3a. a qRT-PCR analysis of Il17a mRNA expression in colon biopsies from non-infected and CR-infected WT mice treated or not with IL-33. Data from two independent experiments are shown as mean ± SEM of fold change induction over non-infected, PBS-treated group. b Flow cytometry dot plots of one representative infected colon showing the gating strategy applied to assess the proportion of IL-17A+ cells among Foxp3-CD4+ T cells (right panel) within the colonic lamina propria. c Frequencies and absolute numbers of IL-17A+ cells were measured among Foxp3-CD4+ T cells. d Percentage of ST2+ cells among Th17 cells. Bars represent the mean ± SEM of data from three independent experiments (n = 9–12 mice per group). All statistical analyses were performed using one-way ANOVA followed by Tukey’s multiple comparison test or Kruskal-Wallis ANOVA with Dunn’s multiple comparison test. e Sort-purified splenic CD4+CD25- T cells were cultured for 5 days under Th17-polarizing conditions in presence or absence of IL-33. On day 5, cells were counted and stained for FACS analysis. The same gating strategy applied to colonic LPLs and shown in panel b was used in this particular dataset to measure the percentage and absolute numbers of IL-17A-expressing cells among Foxp3-CD4 T cells (e), and to assess their mean fluorescent intensity (MFI) for IL-17A (f). In the same experiments, the percentage of Foxp3+ cells among CD4+ T cells was evaluated (g). Data from two independent experiments are shown (n = 6 mice). h Sort-purified CD4+CD25- T cells were labeled with the proliferation dye eFluor 670 and cultured for 5 days under Th17-polarizing conditions with or without IL-33. Proliferation was determined as loss of eFluor 670 by flow cytometry. Representative histogram-overlay is illustrated. Bars indicate the mean ± SEM of n = 2 mice. Statistical analyses were performed using Paired t test. *P < 0.05; **P < 0.01; ***P < 0.001.

