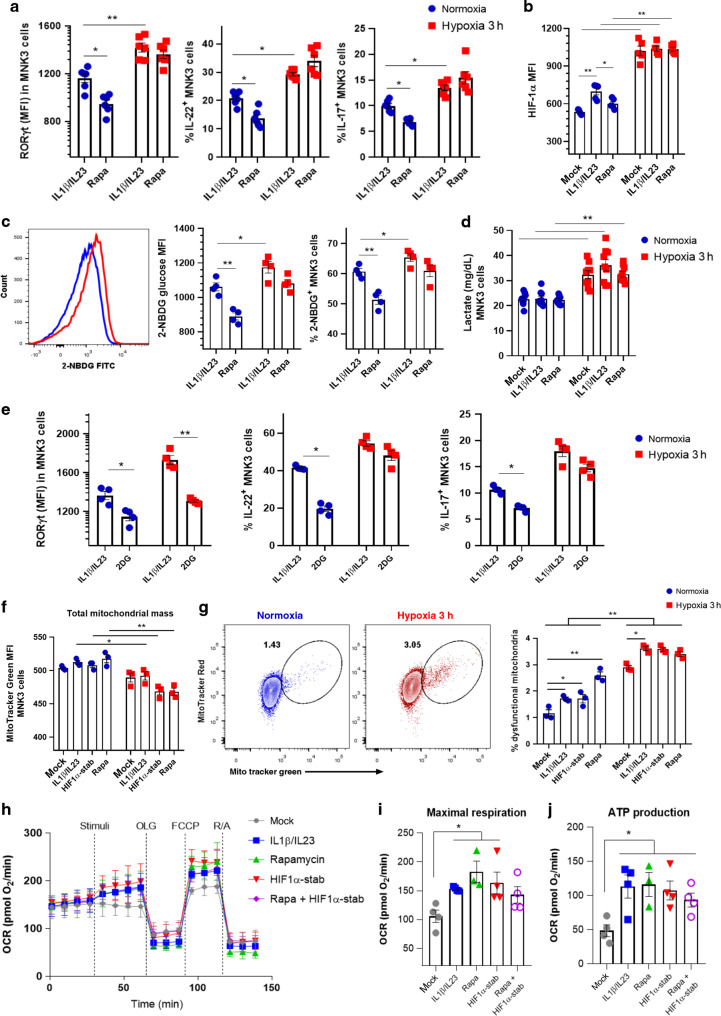
Fig. 3. ILC3 cell line under hypoxia do not depend on glycolytic metabolism and mitochondrial respiration.
A RORγt geometric MFI and IL-22 and IL-17 content in stimulated MNK3 cells after 3 h under normoxia/hypoxia with and without rapamycin treatment (n = 6). B HIF-1α geometric MFI in MNK3 cells incubated 3 h under normoxia or hypoxia with different conditions: unstimulated (mock); IL-1β and IL-23 stimulated; and IL-1β, IL-23 and rapamycin (Rapa) treated (n = 5). C Uptake of glucose (2-NBDG) by flow cytometry in stimulated MNK3 cells with and without rapamycin treatment (n = 4). A representative histogram is on the left and graphs showing MFI and percentages are on the right. D Lactate release by MNK3 cells during 3 h incubation in hypoxia/normoxia under different conditions, as described in B (n = 9). E RORγt geometric MFI and IL-22 and IL-17 content in stimulated MNK3 cells, treated with 2DG for 3 h under normoxia/hypoxia (n = 4). Total mitochondrial mass (F) and mitochondrial membrane potential (G) in MNK3 cells labeled with MitoTracker Green and MitoTracker Red after 3 h incubation in normoxia or hypoxia (n = 3). Cells were stimulated with IL-1β + IL-23 and treated or not treated with HIF-1α stabilizer (stab) or rapamycin. Real-time changes (H), maximal respiratory capacity (I), and ATP production (J) in the OCR of MNK3 cells after stimulation and treatment with oligomycin (OLF), FCCP, and rotenone/antimycin A (R/A) (n = 4). Cells were stimulated or not with IL-1β + IL-23 and treated or not with HIF-1α stabilizer (stab) and/or rapamycin. Results are performed at least twice (except H-J) and presented as mean ± SEM. *p < 0.05; **p < 0.01.

