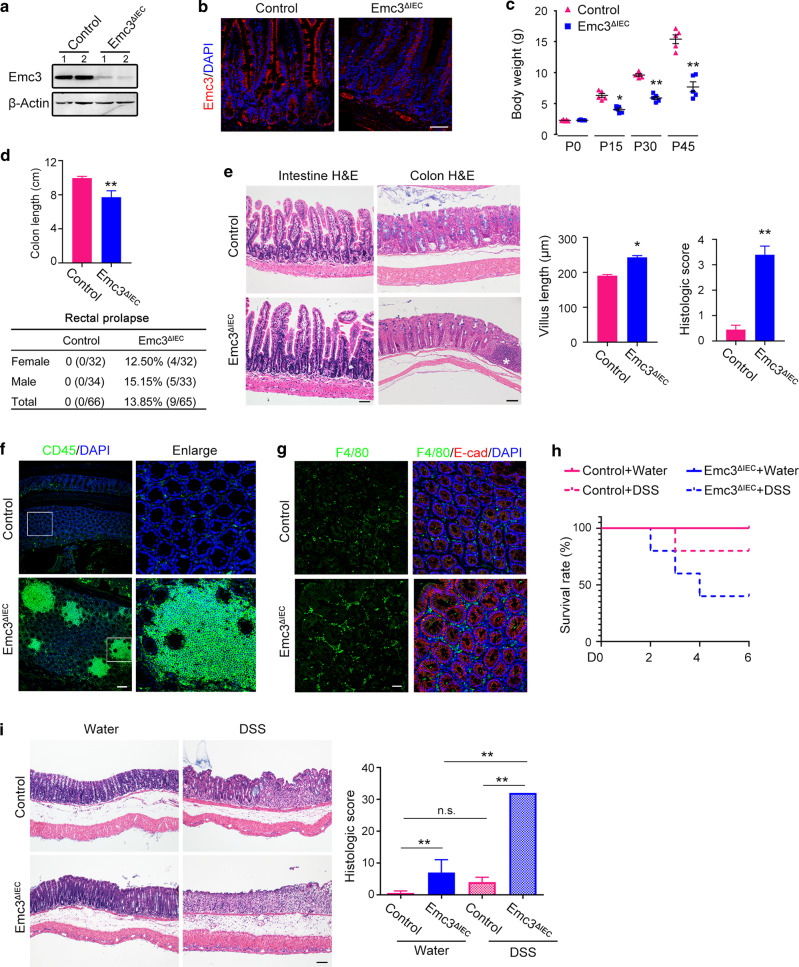
Fig. 1. Emc3 deletion leads to spontaneous inflammation and increased susceptibility to DSS-induced colitis.
Pattern of Emc3 expression detected by western blot (a) and immunofluorescence (b) from 8-week-old control and Emc3ΔIEC ileum. n = 2 independent samples for each genotype. β-Actin was used as a loading control. Scale bar, 50 μm. c Body weight comparison between control and Emc3ΔIEC mice at indicated time points. Data represent mean ± SEM. n = 5 for each genotype. Wilcoxon’s rank sum test: **p < 0.01. *p < 0.05. d Upper panel: length of colon (cm). n = 5 for each genotype. Student’s t-test: **p < 0.01. Lower panel: the incidence of rectal prolapse determined in male and female mice (8–16 weeks, n, indicated). e Morphology of intestinal mucosa revealed by H&E staining. Right panel: the length of villus and histologic score of colitis. n = 5 for each genotype. Data represent mean ± SEM. Student’s t-test: **p < 0.01, *p < 0.05. Scale bar, 50 μm. Asterisk indicates an inflammation focus in mutant colon. Representative images of colonic sections stained with leukocytes (f) and macrophages (g) marker. E-cad was used to visualize epithelium. Scale bar, 50 μm. h Kaplan–Meier survival curve during DSS treatment. i Colonic sections stained by H&E and histological scores of DSS-induced colitis. n = 3 for per group. Statistical data represent mean ± SEM. One-way ANOVA: **p < 0.01, n.s. not significant. Scale bar, 50 μm.

