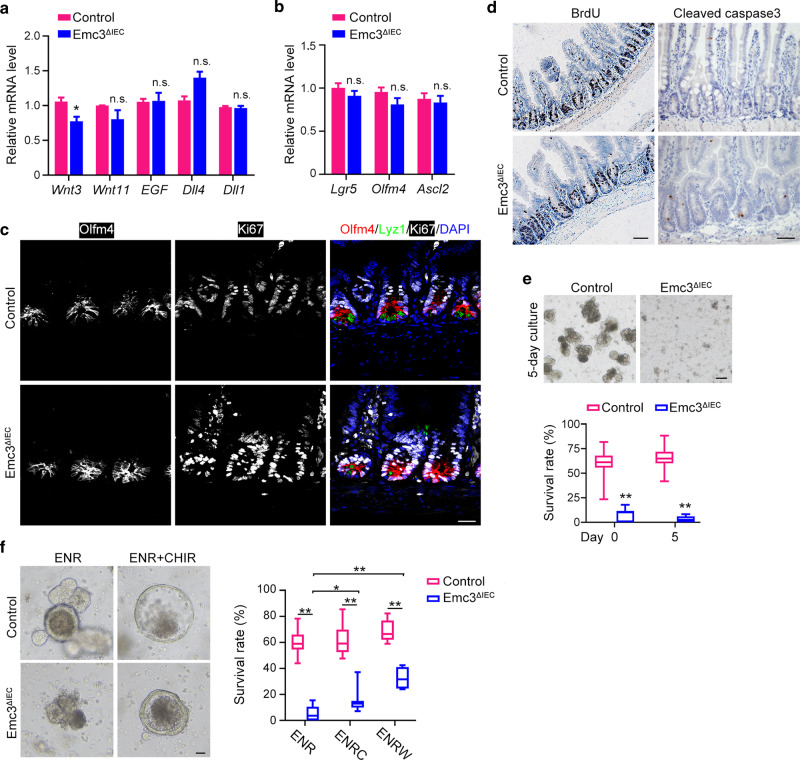
Fig. 4. Emc3 deletion ablates the Paneth niche support for intestinal stem cells.
Relative expression of growth factors/ligands (a) and intestinal stem cell markers (b) in isolated epithelial cells from control and Emc3ΔIEC crypts. n = 6 for each genotype. The statistical data represent mean ± SEM. Student’s t-test: *p < 0.05, n.s. no significant. c Co-immunostaining of ileal sections for proliferative marker (Ki67), stem cell marker (Olfm4), Paneth cell marker (Lyz1). Scale bar, 50 μm. d Proliferation and apoptosis detected by BrdU (2 h after injection) and Caspase3 staining, respectively. Scale bar, 50 μm. e Representative images of intestinal organoids generated from isolated crypts and cultured for 5 days. Lower panel: quantification of organoid formation ratio. Data are shown as box-and-whisker plots. n = 4 for each group. Student’s t-test: **p < 0.01. Scale bar, 100 μm. f Representative images of intestinal organoids in the presence of 3 μM CHIR99021 or vehicle for 5 days. Right panel: organoid formation ratios. Data are shown as box-and-whisker plots. n = 4 for each group. One-way ANOVA: **p < 0.01, *p < 0.05. Scale bar, 10 μm. E EGF, N Noggin, R R-Spondin1, C CHIR99021, W Wnt3A.

